
March 21, 2019
A Civic Federation blog post last week raised questions about the revenue estimate attached to Governor J.B. Pritzker’s graduated income tax plan. After the post was published, the Governor’s Office released an explanation of the methodology used to arrive at the estimate.
The new information shows how the plan could bring in $3.4 billion of additional revenue by raising effective tax rates on fewer than 3% of tax filers while lowering rates slightly for the remaining 97%. Key to this result is the relatively rapid growth in high-income households in the years following the Great Recession—a trend that is assumed to continue through 2020.
The plan’s use of this growth assumption and its heavy reliance on volatile high incomes are likely be debated by lawmakers and economists. The Civic Federation is still reviewing the plan and has not finalized its position.
Although Illinois’ flat individual income tax could not be changed to a graduated tax structure until 2021 due to the lengthy process required to amend the Illinois Constitution, Governor Pritzker announced the graduated tax plan on March 7. The plan has not yet been proposed as legislation, but it was cited in documents related to the State’s first bond sale under the Pritzker administration, which is scheduled for March 26.
As described in the previous blog post, the plan would replace Illinois’ current flat tax of 4.95% on all taxable net income (after certain exemptions) with a schedule of tax rates that increase at higher income levels. Under the Governor’s proposal, only tax filers with net income over $250,000 would face a higher marginal rate, the tax rate applied to the last dollar of income. However, filers with net income up to $252,321 would see a lower effective tax rate (the ratio of the total tax paid to net income) due to the tax cuts on their first dollars of income.
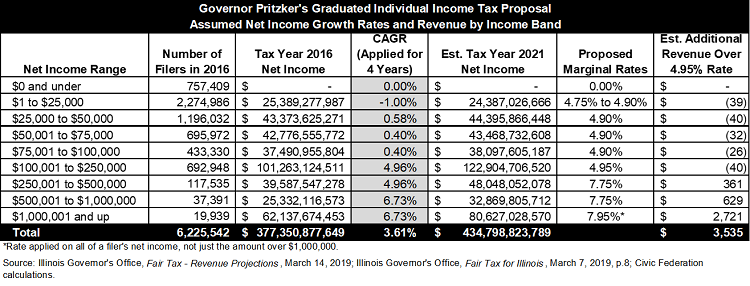
The largest tax increase under the Governor’s plan is for filers with more than $1 million of income. Not only would they pay the highest marginal rate of 7.95%, but all of their income would be subject to that top rate instead of having their first dollars of income taxed at lower rates. According to the new information, filers in this income band are expected to pay $2.7 billion of the total additional revenue.
To determine how much additional revenue could be raised by the plan, the Governor’s Office used data from tax year 2016, the most recently available information from the Illinois Department of Revenue (IDOR). Officials assumed that taxable net income for filers in different income bands would grow at the respective average rates experienced during the prior five years.
Specifically, the Governor’s Office applied the five-year compound annual growth rate (CAGR) from 2011 to 2016 to each band’s net income to estimate net income for 2021. This annual rate was used to grow income in 2017, 2018, 2019 and 2020; income in 2021 was assumed to be unchanged from the previous year to make the estimate more conservative, according to the information provided by the Governor’s Office on March 15. In light of the large tax increase for filers with more than $1 million, officials also assumed that 10% of those with between $1 million and $2 million would find a way to reduce their taxable income to under $1 million.
As shown in the table below, net income for those with more than $100,000 climbed during the five-year period. The highest earners had a CAGR of 6.73%. At $100,000 or below, the growth rates were less than 1% and net income actually declined in the $1 to $25,000 band. Because the Governor’s proposed tax increases are concentrated on the highest earners, this strong income growth at the top results in a large increase in revenue under the plan.
The additional individual income tax revenue from the Governor’s plan is estimated at $3.5 billion in 2021. The plan also includes an increase in the flat corporate income tax rate to 7.95% from 7.0%, which is estimated to generate an additional $332 million. (Corporations also pay a Personal Property Replacement Tax, a 2.5% tax on corporate income.) In all, the plan is expected to bring in $3.9 billion in new revenue. This would be offset by new property tax and child tax credits with a combined cost of $230 million and statutorily required diversions of $237 million of the new income tax proceeds to local governments. The estimated net result of the plan is $3.4 billion in additional revenues.
Total net income growth is driven by both the number of filers in each band and the average income within each band. The following chart shows the change in number of filers by net income band since 2009, the oldest year available on IDOR’s website.
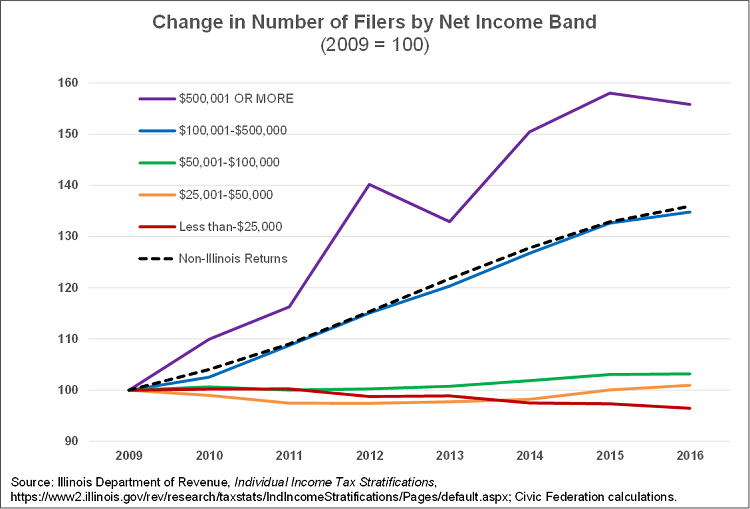
The number of filers with high incomes or from outside Illinois has grown dramatically, whereas the number reporting lower incomes has fallen over the period. The losses are driven by the lowest income band. Part of the pattern could be explained by taxpayers graduating into higher income bands during the long economic recovery from the Great Recession. It may also reflect a divergence of income, with more of the gains going to higher earners.
The other component of net income growth is the change in income per filer within each income band, as shown by the following chart. While the change in income per filer is constrained by the boundaries of each income band, the chart nonetheless shows increasing average income in the highest two bands, as well as out-of-state filers.

In addition to disparate income growth, the charts make clear another pattern: the net income of the highest band is much more volatile than those below. This volatility is not shown by CAGR calculations, which smooth growth rates by only considering the first and last year of a period. This helps to understand long-term trends, but can ignore considerable year-to-year variation. The following table shows the average annual growth and standard deviation by net income band.
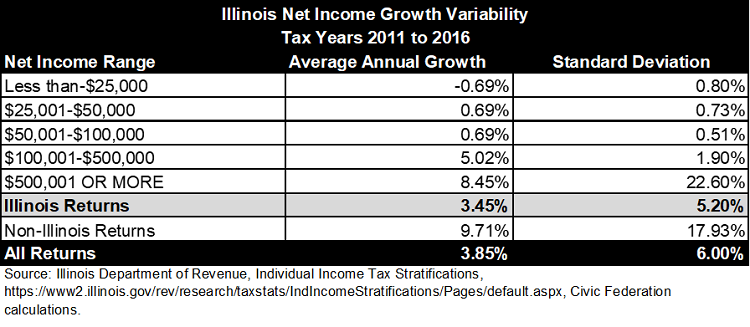
While the top income band had the highest growth, it also swung from a maximum of over 39% in 2012 to loss of almost 18% the following year. The reason for this volatility is that upper incomes depend more on investment and business income, which varies with stock market performance and the business cycle. Lower income ranges, which rely more heavily on labor income, are more stable from year to year. In a recent analysis of Illinois’ economic outlook, Moody’s Analytics pointed to the State’s current above-average reliance on non-wage income such as dividends and interest and its vulnerability to a downturn in the stock market.
Upper-income volatility has important implications for the Governor’s plan, which concentrates its tax increases on the highest earners. While a top-heavy tax structure will lead to higher revenues on average, it will also increase their variance, as explained in a 2014 study by the Commission on Government Forecasting and Accountability. As the General Assembly weighs the Governor’s proposal it should consider the impact on revenue volatility and make appropriate plans, such as building up a rainy day fund.