
October 30, 2013
The State of Illinois will need to contribute somewhat more to its five retirement systems in FY2015, but the growth will be less than previously projected due mainly to strong investment returns.
Pension contributions required by State law will increase by $103.5 million, or 1.5%, to $6.9 billion in FY2015 from $6.8 billion in FY2014, according to preliminary certifications by the five systems. A year ago, the FY2015 contributions were projected to increase by $282.4 million to $7.0 billion.
Due to the favorable investment results, the combined funded ratio of the five systems increased to 41.1% as of June 30, 2013 from 39.0% at the end of FY2012, based on the market value of assets. The systems’ total unfunded liability continued to increase, however, because the State’s statutory pension funding plan defers contributions to the future.
The proposed FY2015 contribution amounts and the FY2013 indicators of funding progress are based on recently completed draft annual actuarial valuation reports. The systems must submit proposed contribution amounts for the next fiscal year by November 1 to the State Actuary. The State Actuary reviews the recommendations before they are forwarded to the Governor and General Assembly. Final certified contribution amounts from the systems are due by January 15 so they can be included in the Governor’s recommended budget for the next fiscal year.
The following table shows State pension fund contributions for FY2014, the FY2015 contributions projected a year ago, the currently proposed amounts for FY2015 and the change between FY2014 actual contributions and FY2015 proposed amounts.

The State’s proposed contribution for the Teachers’ Retirement System (TRS), the State’s largest pension fund, declines by $25.7 million, or 0.7%, from $3.44 billion in FY2014 to $3.41 billion in FY2015. TRS’ proposed FY2015 contribution represents a decrease of $135.3 million from the previously projected FY2015 contribution of $3.55 billion.
In a press release, TRS attributed the slight decline to an investment return of 12.8% in FY2013, net of fees, which compares with the system’s assumed annual rate of return of 8.0%. In FY2012 TRS earned a return of 0.76% on its investments.
As discussed here, TRS’ poor investment results in FY2012 and a change in the system’s assumed rate of return to 8% from 8.5% led to an increase of $735.1 million in TRS’ required State contribution in FY2014 from $2.7 billion in FY2013. Total State contributions for the five systems increased by $966.5 million in FY2014 from $5.9 billion in FY2013.
The State’s proposed contribution for the State Universities Retirement System (SURS) increases by $34.4 million, or 2.3%, to $1.54 billion in FY2015 from $1.51 billion in FY2014. SURS’ proposed FY2015 contribution is $39.6 million below the previously projected FY2015 contribution.
In SURS’ latest actuarial report, the smaller than expected increase was attributed to investment returns of 12.5% compared with an assumption of 7.75%; an increase in total active full-time membership, which increases total expected member contributions; and a reduction in the effective rate of interest assumption from 7.75% to 7.0%. The effective rate of interest is the interest rate applied to member contribution balances.
It should be noted that required FY2015 pension contribution from the State’s general operating funds will be less than the $6.9 billion total contributions shown in the table. Roughly 89% of State pension contributions come from General Funds, with the remainder coming from other funds that support State agency payrolls.
Strong investment returns boosted the combined funded ratio of the five retirement systems to 41.1% at the end of FY2013 from 39.0% at the end of FY2012. These figures are based on the market value of assets. Since FY2009, State law has required that the actuarial value of assets be based on asset smoothing, in which unexpected gains or losses in any fiscal year are recognized over five fiscal years. Market value valuations are more volatile than actuarial valuations but provide a more realistic view of the systems’ actual financial position at the time of measurement.
The combined funded ratio based on the smoothed value of assets declines to 39.3% at the end of FY2013 from 40.4% at the end of FY2012. The smoothed value is lower because it continues to reflect investment losses from prior years and only reflects part of the increase in assets due to high returns in FY2013.
The next table compares funded ratios and unfunded liabilities for the five retirement systems at the end of FY2012 and FY2013, based on the market value of assets.
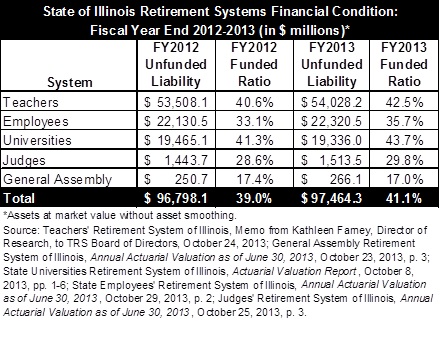
Despite the increase in the combined funded ratio based on the market value of assets, the State’s total unfunded liability continued to rise. The total unfunded liability based on the market value of assets increased by $666.2 million, or 0.7%, to $97.5 billion at the end of FY2013 from $96.8 billion at the end of FY2012. The total unfunded liability based on smoothed asset values increases by $5.9 billion, or 6.3%, to $100.5 billion from $94.6 billion.
State contributions to the retirement systems are based on a 50-year funding plan (Public Act 88-0593) that began in FY1996. After a 15-year phase-in period, the law requires the State to contribute a level percentage of payroll sufficient to bring the retirement systems’ funded ratios to 90% by FY2045.
The funding plan and subsequently enacted changes deferred a large portion of the required State contributions to later years. The funding plan does not conform to reporting standards of the Governmental Accounting Standards Board. For example, TRS’ FY2015 contribution based on actuarial standards would be $4.06 billion rather than $3.41 billion, according to the TRS press release. For most of the funding period, the law has also required State contributions that were insufficient to keep the unfunded liability from growing.
According to actuarial valuations in FY2012, total annual State contributions under the current funding plan were projected to climb to $17.6 billion by FY2045. Contributions were not expected to be adequate to prevent the total unfunded liability from growing until approximately FY2030.
This post was updated on October 31, 2013 to reflect data changes.