
March 23, 2018
In a recent post, this blog analyzed the potential impact on State of Illinois revenues from replacing the current flat income tax rate with a graduated income tax. This post extends the analysis by looking at the effect of combining a graduated tax rate with the Civic Federation’s longstanding proposal to tax retirement income.
As explained here, Illinois, like most states, bases its individual income tax on the federal income tax, with certain modifications. The federal government taxes income from public and private pensions, 401(k)-type plans and a portion of Social Security benefits.[1] Many states follow a similar approach.
However, Illinois excludes all retirement income from the State’s income tax base. Out of the 41 states with broad-based personal income taxes, Illinois is one of three that exclude all retirement income and one of 27 that exclude all federally taxable Social Security income.
Among bordering states, Illinois is an outlier in excluding all retirement income. Although Michigan, Indiana, Wisconsin, Iowa and Missouri all exempt Social Security income, they tax other retirement income. Indiana has the lowest rate of 3.2%, which is a flat income tax rate applied to non-Social Security retirement income.[2] Iowa charges the highest rate, which is the top rate on its graduated income tax scale of 8.98% applied to earners above $70,785, but also exempts specified amounts of retirement income for taxpayers aged 55 or older.
Historically, retirement income has grown at a much faster rate than regular income. Between 2007 and 2015, retirement income in Illinois grew at an average annual rate of about 5.0%, while other personal income increased on average by only 1.2% per year.[3]
How much revenue is lost by not including this high-growth component in the State income tax base? Federally taxable retirement income that was excluded from the Illinois tax base totaled $54.7 billion in tax year 2015, the most recent year for which data are currently available. In years when the personal income tax rate is at or near 5%, this exclusion is the most expensive of all of the State’s tax breaks and the cost is expected to increase rapidly over time as the population ages.
At the current income tax rate of 4.95%, taxing retirement income could raise up to an additional $2.7 billion, or about 7% of projected FY2019 general operating revenues. Actual revenue could be lower if the tax causes changes in behavior, such as an increased use of tax deductions or retirees leaving Illinois for a state with more favorable tax treatment. Research has not shown a strong link between seniors’ interstate migration and state income tax policies.
Illinois adopted broad tax exclusions for retirement income in 1972, three years after enacting its flat-rate income tax. According to the Taxpayers’ Federation of Illinois, the General Assembly decided to exclude retirement income as a compromise solution after a lawsuit and Supreme Court case that challenged the State’s authority to tax pensions and capital gains whose benefits were realized before the income tax was enacted. In addition, the legislature sought to reduce the burden of a flat tax on the elderly poor.
A 2014 analysis by the Taxpayers’ Federation found that taxing retirement income at a flat rate would increase the effective tax rate paid by lower income taxpayers relative to those with higher incomes. The effective tax rate is the percentage of income actually paid in taxes, after various adjustments. This effect is eliminated if a tax on retirement income is combined with a graduated income tax, which applies higher tax rates to higher income levels. If the State wishes to further ensure a low tax burden for low income seniors, it could consider raising the exemption for those aged 65 and above (currently $1,000 per person), or provide a means-tested credit that would more directly achieve that goal.
The following table summarizes the potential revenue increases from adopting various graduated tax rate structures as well as ending the exclusion of federally-taxable retirement income. All of the warnings about these calculations discussed in the previous blog post still apply; these figures are very rough approximations and should be treated as upper-end estimates of the revenue that could be produced from various tax changes.
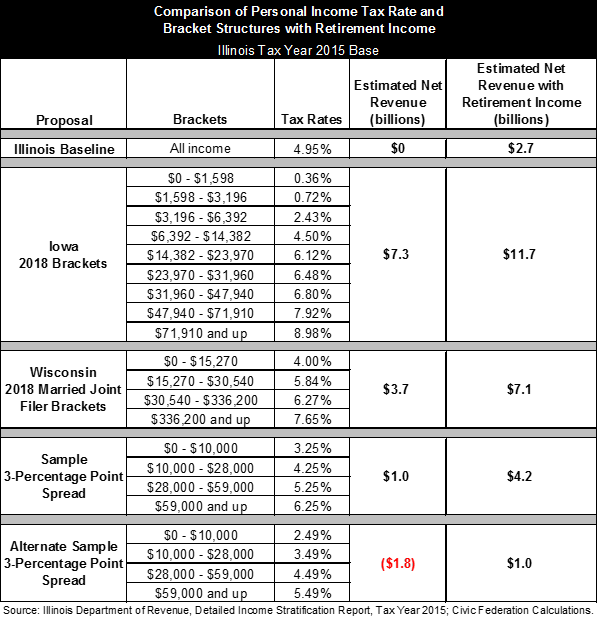
As the table shows, taxing retirement income at the current flat rate of 4.95% could raise up to a maximum of $2.7 billion. Taxing it in tandem with introducing the graduated income tax structures of Iowa or Wisconsin could raise approximately $4 billion in addition to the effects of the graduated tax on income from other sources. In the example structure used in the previous blog post with a maximum spread between the highest and lowest rates of 3 percentage points, the graduated tax on retirement income would raise approximately three times the amount raised by applying graduated rates on other income.
A final example shows that broadening the tax base to include retirement income allows for significantly lower tax rates regardless of the rate structure. Holding additional revenue for the State constant at $972 million, including retirement income means that the rates in the 3-percentage point spread structure can be lowered across the board by 0.76 percentage points.
[1] The federal government excludes between 15% and 100% of Social Security benefits from taxation. Generally, Social Security benefits are not taxable if they represent a taxpayer’s only income. If base income is up to $25,000 for an individual or $32,000 for joint filers, then no tax is owed. Base income is the sum of half of Social Security benefits plus all other income.
[2] Federation of Tax Administrators, State Individual Income Taxes 2018, January 1, 2018, https://www.taxadmin.org/assets/docs/Research/Rates/ind_inc.pdf. Many Indiana counties charge an additional income tax.
[3] Civic Federation calculations based on Internal Revenue Service, SOI Tax Stats-Historic Table 2, https://www.irs.gov/uac/soi-tax-stats-historic-table-2.