
April 11, 2013
Despite historically low interest rates, bonds recently sold by the State of Illinois continue to cost much more than debt issued by other states. Even when compared to similarly low-rated California bonds, the $450 million of tax-exempt bonds sold by Illinois appear to have cost the State at least $20.6 million more than what California might have paid for the same borrowing.
On April 2, 2013, the State issued a total of $800 million of 25-year General Obligation (GO) bonds, including additional taxable bonds totaling $350 million on top of the tax-exempt portion. According to a press release from the Governor’s Office of Management and Budget (GOMB), both the taxable bonds and the tax-exempt bonds were sold at some of the lowest interest rates for Illinois debt in the last 20 years.
GOMB’s statement also acknowledged that Illinois continues to pay a penalty compared to other governments for its ongoing financial crisis and lack of action on comprehensive pension reform. However, the press release did not include an estimate of how much that penalty may be.
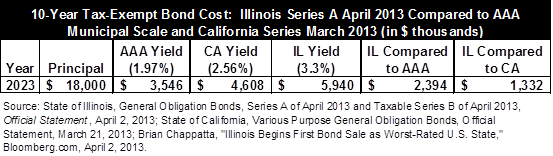
According to reports from Bloomberg, on the day of the bond sale high quality tax-exempt municipal bonds that matured in 10 years were priced at a yield of 1.97%. The taxable Illinois GO Bonds that mature in 10 years received a yield of 3.3%, or 1.33% higher than the AAA bond price. By comparison, California’s 10-year tax-exempt GO Bonds, sold on March 21, 2013, earned a yield of 2.56%.
The $450 million in principal of the tax-exempt Illinois bonds was broken up into equal portions of $18.0 million, maturing each year over 25 years. If the AAA-bond yield and the California yield discussed above were applied to the $18.0 million of Illinois bonds maturing in 10 years, it can be estimated that Illinois will pay approximately $2.4 million more for that portion compared with an AAA-rated issuer and $1.3 million more than California. The following chart shows this comparison. (Click to enlarge.)
The chart above calculates the total cost paid over ten years on just the $18 million in bonds maturing in 2023. However, the bonds sold in each year end up having a slightly different annual yield over the life of the bonds. To calculate the total additional bond cost paid by Illinois, it is not appropriate to simply multiply the difference shown above by the number of years the bonds are outstanding. Instead, it is necessary to examine the yield earned on the bonds each year.
In 2010 the Civic Federation released the Cost of the Crisis report, which compared the individual yields by year of $9.6 billion in bonds sold by Illinois over twelve months to the yield earned by other slightly better-rated bonds. By applying the yields charged to governments with better ratings to the same principal and maturity schedule as the Illinois issuances, the Federation was able to make a reasonable estimate of the additional long-term cost the State was charged for access to the credit market. The report estimated that for just one year’s worth of borrowing the State would pay more than $550 million in additional borrowing costs over the life of the bonds when compared to better rated municipal issuers.
The same methodology was used to compare the tax-exempt portion of the Illinois bonds sold last week to the tax-exempt portion of the California issuance a month earlier. The analysis shows that the additional cost paid by Illinois totals $20.6 million. (Data is not available for a comparable analysis of the taxable bonds or for a comparison of the Illinois issuance with the AAA municipal scale.)
The following chart shows the interest cost based on the yield on Illinois bonds compared to how much it would have cost if the $450 million Illinois issuance had earned the same yield as California did for its March bond issuance. (Click to enlarge.)
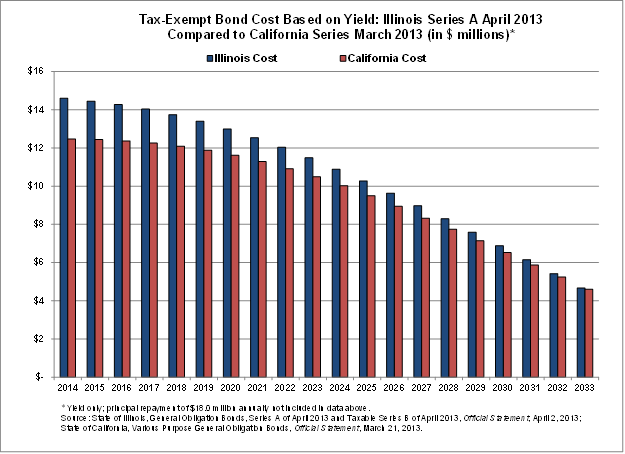
As shown in the chart above, the largest difference in cost comes early in the life of the bonds when more principal is outstanding and the difference in yields is further apart. The following table shows the year-by-year calculation of the savings.(Click to enlarge.)
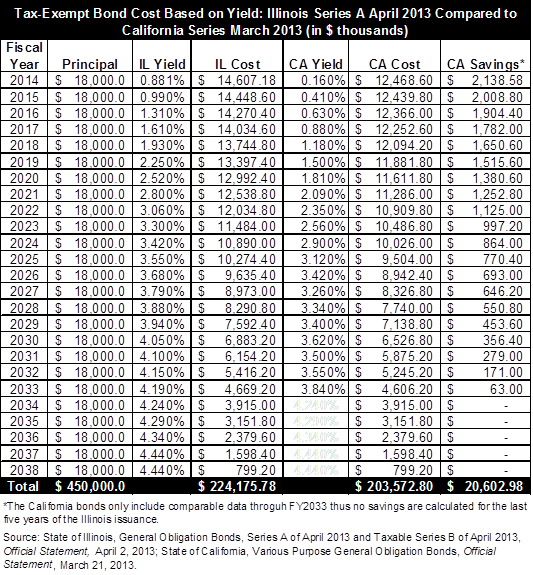
The estimated savings in the table above is slightly conservative. Due to a lack of comparable data from the California issuance, no savings are included for the last five years of the bonds. Since any reduction in the yield in these later years would be applied to the 20 previous years, it could significantly increase the difference in cost. As shown in the table, however, the difference in the yields between the issuances narrows for the long-term bonds. In 2023 Illinois’ bonds yield 3.3% while California’s yield 2.56%, a difference of 0.74%; by 2033 this difference is reduced to only 0.35%, as Illinois yields 4.19% and California yields 3.84%.
This analysis uses the yield of the bonds to determine total interest cost. Yield is the ratio of the actual price paid for bonds compared to the periodic interest owed to the bondholder or lender. Yields are calculated from the actual cost the issuer pays on the loan as opposed to the interest rate, which is simply the ratio of interest to principal of the loan. Calculating yield also takes into account any discount or premiums that may arise in the market at the time of the bond sale. Frequently a seller may give a quantity discount or lower the price of a bond to earn a better interest rate on a particular series of bonds or pay a higher rate of interest if the lender pays more than the coupon price for a bond. Yield captures discounts and premiums that may occur in the actual sale of a bond and ultimately the actual total cost an issuer pays.
Calculating the potential interest costs using yields from the comparable bonds in this analysis is not an absolute determination of the exact rates that would have been earned in the market. This analysis aims to provide a rough estimate of how much more the State may have paid above California’s bonds sold under similar market conditions.
As discussed here, following numerous downgrades in the past five years, the State of Illinois has the lowest credit rating of any state from two of the three major rating agencies. Illinois has the lowest credit rating from Moody’s Investors Service and Standard & Poor’s and the second lowest behind California from Fitch Ratings.
The rating assigned to municipal debt is often the starting point in determining how much an issuer will end up paying to access the credit markets. It is also common for investors to disagree with rating agencies and demand higher yields or steer clear of bonds based on their own internal market analysis. Market conditions are also taken into consideration, including other issuers in the market, the amount of outstanding bonds still available from previous sales and the prospects for a bond issuer’s future fiscal health compared to other issuers. The more negative a state’s overall financial picture, the higher the interest rates that the market demands for the sale of bonds.
For more information on the methodology of this analysis and comparisons of previous Illinois bond issuances, see the Cost of the Crisis report.