
October 01, 2014
This week the Civic Federation released its annual Effective Property Tax Rates report. The report highlights the fact that in 2012 property tax burdens for many Northeastern Illinois communities rose. While analysis of the report often focuses on the 12 Cook County municipalities included in the study, especially Chicago, this blog will look at the selected communities in the collar counties.
Effective property tax rates is an average calculation that offers a method of comparing residents’ property tax burdens across municipalities and counties. For example, this report shows that in 2012 the average property tax burden for property owners in Joliet in Will County was 3.52%. More simply stated, in 2012 a property owner in Joliet with real estate worth $200,000 paid an average of $7,040 in property taxes.
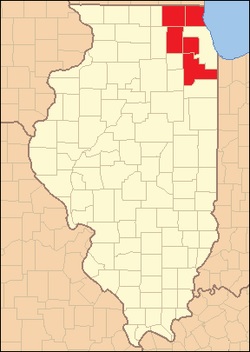
The counties surrounding Cook County in Illinois, known as the  “collar counties” are, moving counter clockwise from north to south, Lake, McHenry, Kane, DuPage and Will Counties. Unlike in Cook County, which assesses different types of properties (residential, commercial, industrial) at different rates for the purpose of property taxation, the collar counties assess all types of property at 331/3%. The map shows the location of the collar counties in relationship to the rest of the State of Illinois. There are 102 counties in Illinois. (Image from Wikipedia.)
There is a wide variation in 2012 effective property tax rates among the selected collar county communities. The lowest rate of 1.34% was in Oak Brook in DuPage County and the highest rate among the selected collar county communities was in Waukegan in Lake County at 7.19%. Variations between collar county communities reflect differences in property wealth and the extent to which local governments are dependent on property taxes. Oak Brook has high real estate values and a diversified tax base that includes significant retail sales tax revenues. Waukegan has relatively lower property values and relies more heavily on property taxes to fund its local governments.
The following chart shows tax year 2012 effective property tax rates for the selected communities in each of the collar counties studied.
