October 29, 2021
Short-term or current liabilities are financial obligations that must be satisfied within one year. These include short-term notes, accounts payable, amounts due to other funds, accrued payroll and other current liabilities.
Rating agencies, financial analysts and the Civic Federation regularly track trends in short-term liabilities to help evaluate the overall fiscal health of governments. This blog post reviews Cook County short-term liability trends in the Governmental Funds for the five-year period between FY2016 and FY2020. FY2020 is the most current year for which audited financial data are available.
TYPES OF COOK COUNTY SHORT-TERM LIABILITIES
Cook County reported the following short-term obligations due for the next fiscal year in the governmental funds in its FY2020 Annual Financial Report. These liabilities include:
- Accounts payable: Monies owed to vendors for goods and services carried over into the new fiscal year;
- Retainage payable: The portion of a contract’s final payment withheld until the project is complete;
- Accrued salaries payable: Employee pay carried over from the previous year;
- Due to other funds, others or other governments: These are monies owed to other funds for services that have been rendered that are outstanding at the end of the fiscal year;
- Notes payable: Short-term loans due within the next fiscal year; and
- Other liabilities: Include self-insurance funds (the County is self-insured for various types of liabilities, including medical malpractice, workers’ compensation, general automobile and other liabilities), unclaimed property and other unspecified liabilities.
TOTAL SHORT TERM LIABILITIES
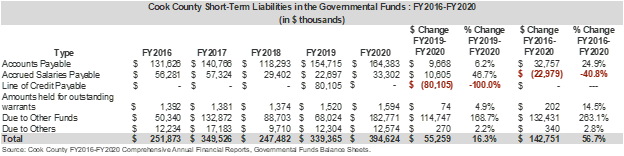
In FY2020 short-term liabilities totaled $394.6 million, an increase of 16.3%, or $55.3 million, from the prior fiscal year. Much of the change was primarily due to the following two factors:
- A $114.7 million, or 168.7%, increase in Due to Other Funds. These amounts account for transfers between the General Fund and other funds such as Special Revenue, Capital Projects and the Cook County Health Systems enterprise fund. The transfers are the result of the time lag between the dates that inter-fund goods and services are provided, the date transactions are recorded in the accounting system and the date payments between funds are made. They may also be due to reclassifications of cash between funds to eliminate negative cash balances in particular funds as of November 30, 2020.
- The County refinanced the short-term $80.1 million line of credit from FY2019 with the issuance of a $169.3 million long-term sales tax revenue bond in January 2021.
Since FY2016 short-term liabilities have increased by $142.8 million or 56.7%. The largest changes occurred within three categories: Accrued Salaries Payable declined by nearly $23.0 million or 40.8%, from $56.3 million to $33.3 million; Amounts Due to Other funds increased by $132.4 million and accounts payable rose by $32.8 million, or 24.9%.
SHORT-TERM LIABILITIES TO OPERATING REVENUES RATIO
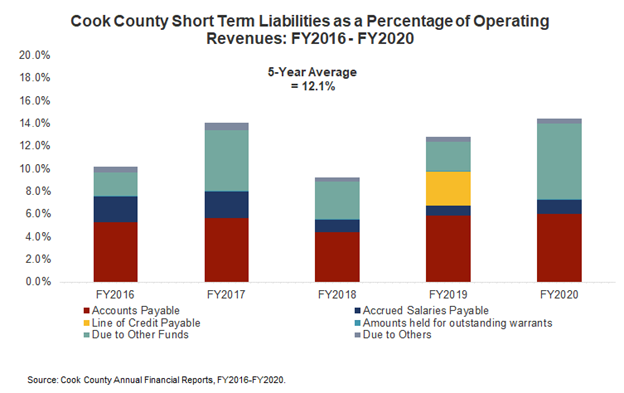
Increasing current liabilities in a government’s operating funds at the end of the year as a percentage of total operating revenues may be a warning sign of a government’s future financial difficulties. This indicator, developed by the International City/County Management Association (ICMA), is a measure of budgetary solvency or a government’s ability to generate enough revenue over the course of a fiscal year to meet its expenditures and avoid deficit spending.
Cook County’s ratio of short-term liabilities to total operating revenue has fluctuated over time. Between FY2016 to FY2017, it rose from 10.2% to 14.1%, primarily because of an increase in the Due to Other Funds category. It fell to 9.2% in FY2018 due to a sharp decline in Due to Other Funds before rising again in FY2018 to 12.8% as Accounts Payable rose and the County entered into a line of credit. In FY2022 the ratio rose to 14.1% as the amount due to other funds increased. The ratio averaged 12.1% over the five-year period.
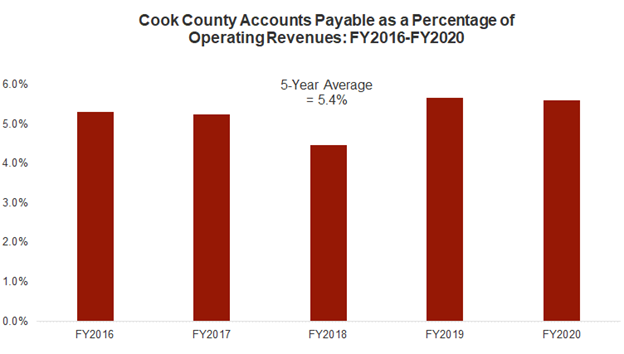
ACCOUNTS PAYABLE AS A PERCENTAGE OF OPERATING REVENUES
Over time, rising amounts of accounts payable compared to operating revenues may indicate a government’s difficulty in controlling expenses or keeping up with spending pressures. Cook County’s ratio of operating funds accounts payable to operating revenues rose slightly from 5.3% in FY2016 to 5.6% in FY2020. The five-year average ratio was 5.4%. The ratio is relatively low and thus is not a cause for concern.
DAYS OF CASH ON HAND
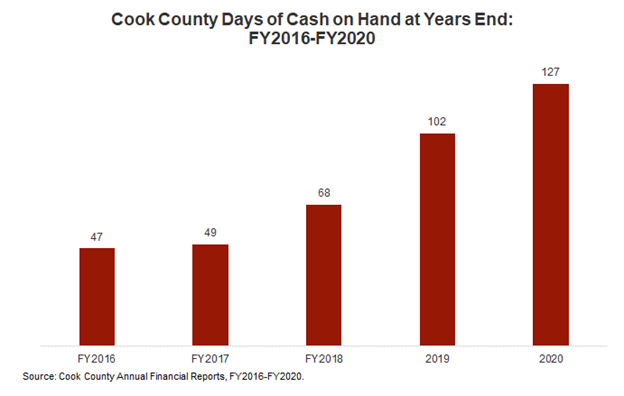
Days of cash on hand is a widely used liquidity ratio. It shows how long an organization could meet its daily expenses using the cash on hand or assets that can quickly be turned into cash. It is calculated by dividing the amount of cash and marketable securities in the governmental funds by daily operating expenses in those funds. A government should maintain several months’ worth of cash to pay bills as they come due. It is a sound practice to have at least enough cash on hand to exceed the length of a typical billing period, or 30 to 60 days. Between FY2016 and FY2020, Cook County reported that the days of cash on hand at year-end rose from 47 to 127 days, a 170.2% increase. The County has met the best practice standard in all five years examined.
CURRENT RATIO
The current ratio is a measure of liquidity. The ratio is calculated by dividing current assets by current liabilities. It assesses whether the government has enough cash and other liquid resources to meet its short-term obligations as they come due. A ratio of 1.0 means that current assets are equal to current liabilities and are sufficient to cover obligations in the near term. Generally, a government’s current ratio should be close to 2.0 or higher.
In addition to the short-term liabilities listed above, the current ratio formula includes the current assets of a government, such as:
- Cash and cash equivalents: assets that are cash or can be converted into cash immediately, including petty cash, demand deposits and certificates of deposit;
- Investments: any investments that the government has made that will expire within one year, including stocks and bonds that can be liquidated quickly;
- Receivables: monetary obligations owed to the government including grants, loans, property taxes and accrued interest;
- Due from other governments: monies due from local property taxes that have been determined or billed but not yet collected and/or monies due but not yet disbursed from the State of Illinois or the federal government; and
- Due from other funds or others: receivables that are outstanding at the end of the fiscal year.
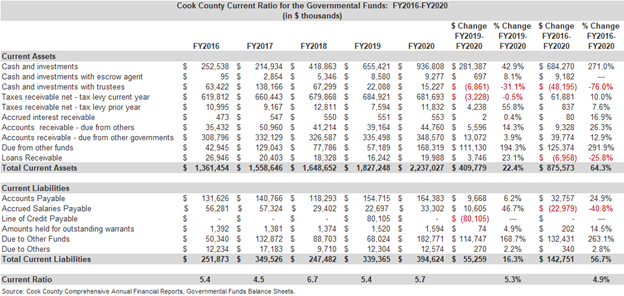
Cook County’s current ratio was 5.7 in FY2020, the most recent year for which audited data are available. It rose from the prior year ratio of 5.4 because short-term assets rose by 22.4%, or nearly $410.0 million, while short-term liabilities rose by only $55.3 million at the same time.
In the five-year period from FY2016 to FY2020, the current ratio rose by 4.9%, from 5.4 to 5.7. The increase occurred because assets increased by a larger amount and percentage than liabilities. Assets increased by $875.6 million or 64.3% while liabilities concurrently increased by $142.8 million or 56.7%.
In each of the five years reviewed, the current ratio was far above 2.0, indicating that the County had more than sufficient liquidity.