
January 11, 2019
A new study by a state commission in Pennsylvania compares the investment expenses paid by large public pension funds. Although such comparisons are difficult because of vast reporting discrepancies, the study still raises important questions about investment expenses of these funds—including some in Illinois.
The Pennsylvania commission, established in 2017 by statute, was charged with reviewing the operations of two state pension funds and making recommendations to reduce investment costs and improve transparency of investment fees. The commission’s final report, issued in December 2018, shows estimates of each fund’s spending on investment management compared with other major public pension plans in the United States.
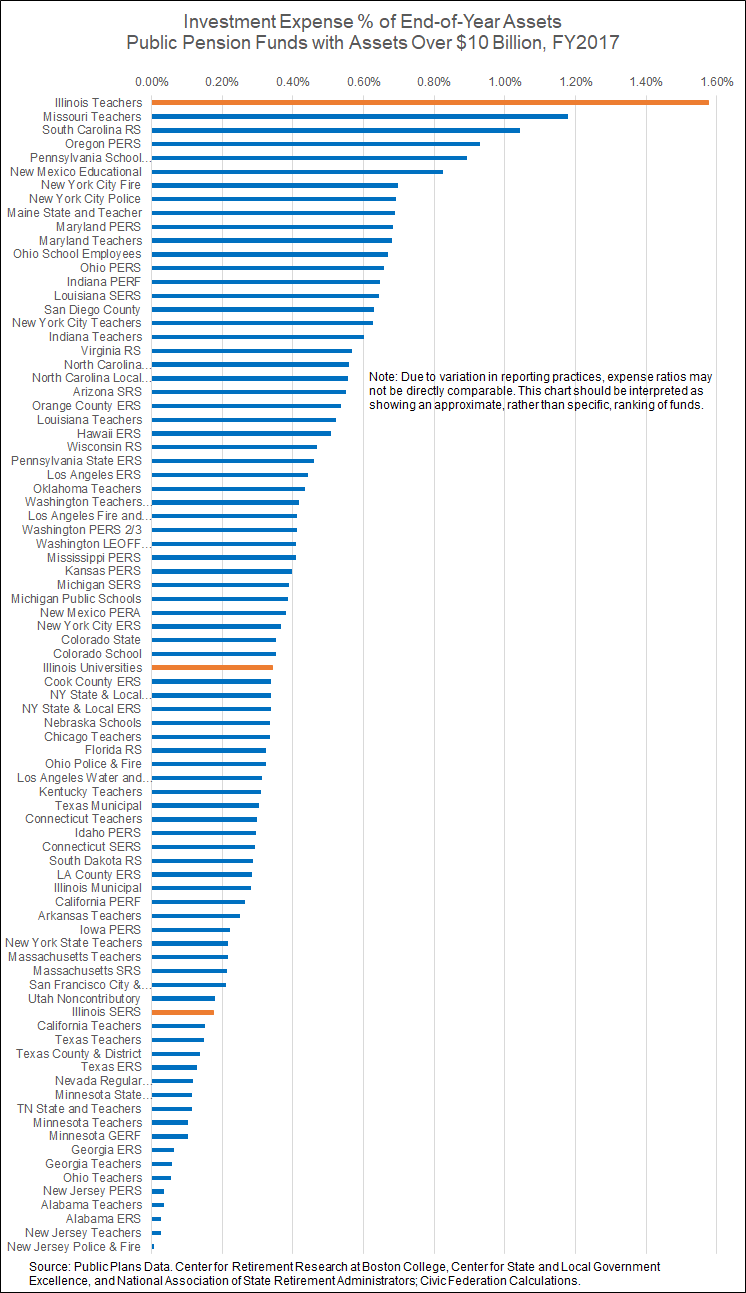
Among 84 funds with assets over $10 billion, the Pennsylvania Public School Employees’ Retirement System (PSERS) had the fifth highest reported investment expenses for the year ended June 30, 2017 at 0.89% of assets, or $474.4 million. The Pennsylvania State Employees’ Retirement System (SERS) ranked 27th in FY2017 at 0.46%, or $135.1 million. By far the most expensive on the list was Illinois’ largest fund, the Teachers’ Retirement System (TRS), at 1.58%, or $778.6 million.
The following chart replicates the one in the Pennsylvania study, based on information from Boston College’s Public Plans Data website. TRS and two other Illinois funds are highlighted: the State Universities Retirement System (SURS), ranked 42nd with an expense ratio of 0.34% and expenses of $63.3 million, and the Illinois State Employees’ Retirement System (Illinois SERS), ranked 67th at 0.17% with expenses of $28.9 million. The average expense ratio for the 84 funds was 0.37%.
Caution should be used in interpreting this information. As noted in the Pennsylvania report, it is difficult to precisely compare investment expenses among public funds because they are not reported consistently. This is particularly true for expenses related to so-called alternative investments that are not publicly traded, such as real estate, private equity and hedge funds.
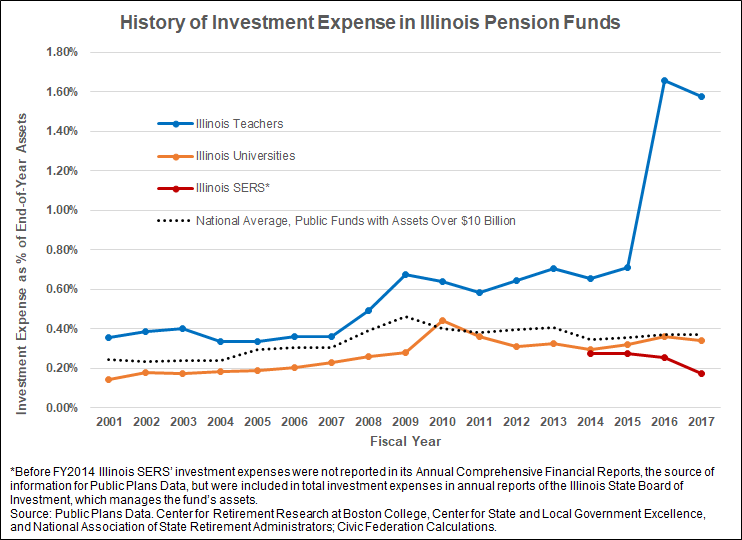
Illinois TRS’ ranking is partly attributable to a reporting change in FY2016 that more than doubled investment expenses, according to a spokesperson. Before FY2016, TRS subtracted real estate investment expenses from real estate income and showed only net real estate income in its Comprehensive Annual Financial Reports (CAFRs); the fund subsequently reported real estate expenses and income separately. Although the change made TRS’ investment expenses appear higher, it did not have any financial impact, the spokesperson said. Without the additional expenses related to real estate and other alternative investments, TRS’ investment expenses in FY2017 would have been $349.6 million instead of $778.6 million and its expense ratio would have been 0.70% instead of 1.58%.
Similarly, officials at PSERS said its investment expenses appear relatively high because it reports management fees for alternative investments separately, rather than subtracting them from investment income. PSERS “is one of the most transparent funds in the U.S. regarding disclosure of management fees,” the officials wrote in an article on an investment industry website.
The South Carolina Retirement System, ranked 3rd in the chart above with an expense ratio of 1.04%, also reports carried interest, a significant element of investment manager compensation for alternative investments. While base management fees are charged as a percentage of assets, carried interest is a share of profits that accrues to the investment manager, typically 20% above a certain threshold return to the pension fund. In its FY2017 CAFR, the South Carolina fund explained that there is no industry standard for reporting public pension plan investment fees and expenses, so comparisons with other plans should be made with care.
The variation in reporting of alternative investment expenses stems from flexible accounting rules. Before FY2014, the Governmental Accounting Standards Board (GASB) Statement 25 did not require public pension funds to report investment expenses that were not “readily separable” from investment earnings or general administrative expenses. GASB Statement 67 revised the statement to indicate that investment-related costs should be included if they are “separable.” However, the statement does not define which costs are separable and which are not.
Some have called for increased, standardized disclosure of private equity fees, such as carried interest, pointing to South Carolina’s example. The Pennsylvania study recommended that the state’s funds use a disclosure template developed by the Institutional Limited Partnership Association, a group of investors in private equity that includes some public pension funds, and that the Pennsylvania General Assembly consider requiring use of the template.
Besides reporting differences, funds’ investment expenses can vary due to the mix of investments. Over the past decade, public pension funds across the country have increasingly turned to higher-fee alternative investments to meet their investment return targets, but the use of alternative investments varies widely. In FY2017 TRS had 40.3% of its portfolio in alternative investments, 35.5% in stocks and 21.5% in bonds; for the 81 funds with assets over $10 billion that report allocations, the average mix was 26.2% alternative investments, 48.9% stocks and 22.4% bonds, according to Public Plans Data. (These numbers don’t sum to 100% because of a small percentage of assets in cash and other investments.)
Investment expenses also depend on whether a fund’s investment approach emphasizes high-fee active management or low-fee indexing. As explained in the Pennsylvania study, active investing involves managing a portfolio to outperform the returns of a given market index, while index or passive investing involves investing in a set of securities to replicate the performance of a market index. TRS uses indexing for 33.5% of its stock portfolio. Illinois SERS, whose assets are managed by the Illinois State Board of Investment, has 65.9% of its total portfolio in index-type investments. In 2016 the Board of Investment revised its investment strategy to focus on indexing and reduce its exposure to hedge funds.
The next chart shows investment expense as a share of assets for Illinois’ three largest pension funds from FY2001 to FY2017, based on Public Plans Data. The spike in TRS’ costs after FY2015 is explained by the reporting change discussed above, while Illinois SERS’ expenses appear to decline due to the strategic changes in 2016. Public Plans Data does not have investment expense information for Illinois SERS prior to FY2014 because it was included in the Board of Investment’s annual reports but not in the fund’s CAFRs.
Of course, even high investment expense is justified if it results in a higher return. However, the Pennsylvania study concluded after subtracting fees and adjusting for the risk of various asset classes that low-cost investments usually outperform most managers.
The Illinois General Assembly should consider requiring a similar study of its public pension funds. While the recent change in reporting by TRS is a step in the right direction, the public would benefit from uniform, comprehensive reporting of fees across all systems. Moreover, a systematic examination of asset allocation, investment approach and manager selection would help ensure that investment expenses are warranted.
Although investment costs are important, neither increasing investment returns nor reducing investment costs will solve Illinois’ pension problems. At the end of FY2018, the State’s five retirement systems—including TRS, SURS, Illinois SERS and the Judges’ and General Assembly Retirement Systems—had a total unfunded liability of $133.5 billion and only 40.2% of the estimated assets needed to pay future benefits.
Illinois is expected to spend $7.1 billion, or 18.2% of its general operating expenses, on pension contributions in FY2019. Even so, statutorily required State contributions are not expected to be sufficient to keep the unfunded liability from growing until FY2029.
Under Illinois law, the State’s FY2020 contribution to TRS is $4.8 billion. The fund’s actuaries estimate that full funding would be 63.7% higher at $7.9 billion.