
March 24, 2010
All ten Chicago-area local government pension funds analyzed annually by the Civic Federation had negative investment returns in fiscal year 2008 for a total investment loss of $7.1 billion.[1]
The average FY2008 rate of return for the eight funds with a January 1 to December 31 fiscal year was -25.3%, down from +8.1% the previous year. Rates of return ranged from -14.8% to -33.3% in FY2008, with returns for the Chicago Fire fund being the lowest.
The Park District fund and the Chicago Teachers’ fund use a July 1 to June 30 fiscal year instead of the calendar year used by the eight other funds, thus their rates of return reflect the last half of 2007 and the first half of 2008. As a result, the investment rates of return for the Teachers and Park Funds are not strictly comparable to those of the other eight funds. The average rate of return for funds using a July 1 to June 30 fiscal year was -4.0%, down from +17.1% the previous year.
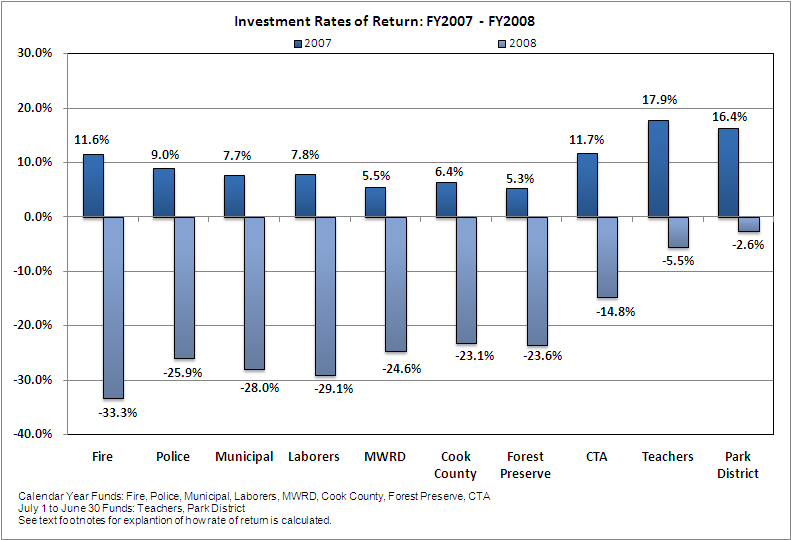
Differences in investment returns may reflect the investment allocation choices of the funds or the performance of investment managers, or both. Some funds choose higher-risk asset allocations in the hopes of achieving higher returns, although this strategy can lead to major losses. The asset allocation policies of the funds differ in ways that are reflected in their rates of return. The Chicago Fire fund, which had a -33.3% return in FY2008, has the riskiest policy of the ten funds with a target of only 15% in fixed income and 85% in equities and alternative investments. In contrast, the Metropolitan Water Reclamation District fund had a -24.6% return in FY2008 and has a fixed income target of 35% and equities target of 65%.
It is now much easier to track both investment allocation policies and investment performance of Illinois public pension funds thanks to Public Act 96-006, enacted in April 2009. P.A. 96-006 requires pension funds (except downstate police and fire funds) to maintain an official web site and to post information including investment policies, contracts and performance.
The web sites for the local public pension funds reviewed annually by the Civic Federation are:
-
Laborers’ and Retirement Board Employees’ Annuity and Benefit Fund of Chicago
-
County Employees’ and Officers’ Annuity and Benefit Fund of Cook County
-
Forest Preserve District Employees’ Annuity and Benefit Fund of Cook County[2]
-
Public School Teachers’ Pension and Retirement Fund of Chicago
-
Park Employees’ & Retirement Board Employees’ Annuity and Benefit Fund
The economic recession that began in December 2007 and the sharp decline in financial markets that began in September 2008 appears to have bottomed out in March of 2009. FY2009 investment results may be strong for funds operating on a January 1 to December 31 fiscal year. Several of these funds reported September 2009 year-to-date returns in the range of 15-20%.
A defined benefit pension fund invests the contributions of employers and employees in order to generate additional revenue over an extended period of time. When rates of return are positive, investment income usually represents the majority of a fund’s total income. Employee and employer contribution amounts are relatively stable from year to year but investment income can fluctuate widely. Multi-year investment gains or losses that deviate substantially from the assumed rate of return have a major impact on fund assets.
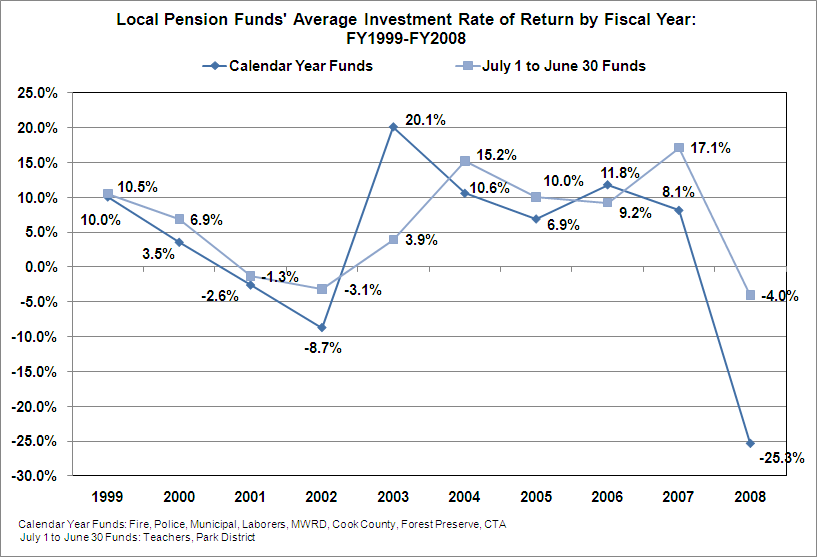
Investment rates of return should be considered from a historical perspective. During the latter half of the 1990s, strong financial markets significantly increased local pension funds’ assets. In 1997 the ten funds experienced rates of return ranging from 18.5% to 37.3%. That positive trend reversed, however, and by the close of FY2002 every fund had a negative rate of return, ranging from –3.4% to –12.9%. The following figure shows ten years of average returns for the calendar year funds and the July fiscal year funds.
[1] The Civic Federation report analyzed fiscal year 2008 data because it is the most recent audited data available for all ten pension funds. The Civic Federation calculates investment rate of return using the following formula for all funds: Current Year Rate of Return = Current Year Gross Investment Income/ (0.5*(Previous Year Market Value of Assets + Current Year Market Value of Assets – Current Year Gross Investment Income)). This is not necessarily the formula used by all funds’ actuaries, thus investment rates of return reported here may differ from those reported in a fund’s actuarial statements. However, it is a standard actuarial formula. Gross investment income includes income from securities lending activities, net of borrower rebates. It does not subtract out related investment and securities lending fees, which are treated as expenses.
[2] The funds of Cook County and the Cook County Forest Preserve District are governed by the same pension board.