October 03, 2012
Trend analysis performed by the Civic Federation shows that the funded status of the Cook County Pension Fund fell again in fiscal year 2011, the most recent year for which data are available. The actuarial funded ratio for the County pension fund fell to 57.5% in FY2011 from 77.3% in FY2007. The fund was over 90% funded as recently as FY2000.
Funded ratio is one of the three main indicators of pension fund fiscal health the Civic Federation uses to evaluate state and local retirement funds. The other two indicators are unfunded liabilities and investment returns.
Pension fund status indicators show how well a pension fund is meeting its goal of accruing sufficient assets to cover its liabilities. Ideally, a pension fund should hold exactly enough assets to cover all of its actuarial accrued liabilities. Actuarial accrued liabilities represent liabilities for future benefit payments due to current beneficiaries, as well as liabilities for benefits earned to date by current employees.
It is important to consider two critical factors when evaluating the status of pension funds.
• First, the status of a pension fund is in large part a function of the actuarial methods and assumptions made. Changes to assumptions based on demographic trends, plan experiences or the selection of a different actuarial method can produce substantially different pictures of a fund’s status.
• Second, because pension financing is long-term in nature, pension fund status is best evaluated by examining multi-year trends, rather than a single year in isolation. Negative multi-year trends are cause for concern and indicate a need for a change in funding strategy or benefit levels. A given indicator that is low, but has been stable for several years, may occasion a lesser degree of alarm than a once-healthy fund that has experienced precipitous decline in recent years.
Funded Ratio
The most basic indicator of pension fund status is its ratio of assets to liabilities, or “funded ratio.” When a pension fund has enough assets to cover all its accrued liabilities, it is considered 100% funded. The optimum situation for any pension fund is to be fully funded, with 100% of accrued liabilities covered by assets. There is no official industry standard or best practice for an acceptable funded ratio other than 100%.
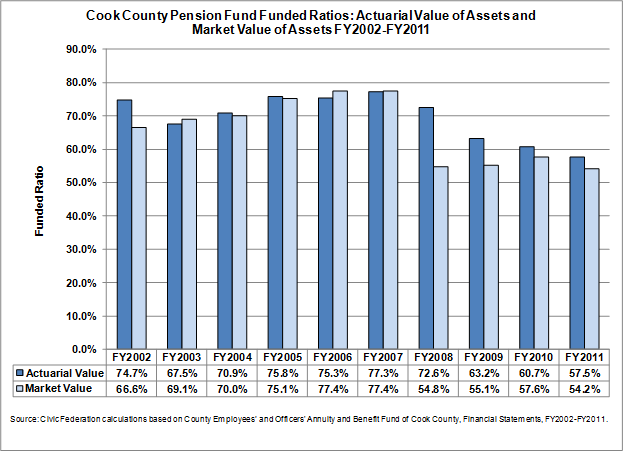
This blog uses two measurements of pension plan funded ratio: the actuarial value of assets measurement and the market value of assets measurement. These ratios show the percentage of pension liabilities covered by assets. The lower the percentage, the more difficulty a government may have in meeting future obligations. The actuarial value of assets measurement presents the ratio of assets to liabilities and accounts for assets by recognizing unexpected gains and losses over a period of three to five years. The market value of assets measurement presents the ratio of assets to liabilities by recognizing investments only at current market value. Market value funded ratios are more volatile than actuarial funded ratios due to the smoothing effect of actuarial value. However, market value funded ratios represent how much money is actually available at the time of measurement to cover actuarial accrued liabilities.
The actuarial funded ratio of the Cook County pension fund has fallen every year since its high mark over the past ten years of 77.3%, achieved in FY2007. The market value funded ratio fell significantly to 54.8% in FY2008 from 77.4% in FY2007 due to negative investment returns in FY2008. Market value funded ratios then rebounded slightly over the next two years before falling again in FY2011. While the County fund had previously not been as poorly funded as some other state and local pension funds, the drastic decline in its actuarial funded ratio over the past five years is a cause for serious concern.
Unfunded Actuarial Accrued Liabilities
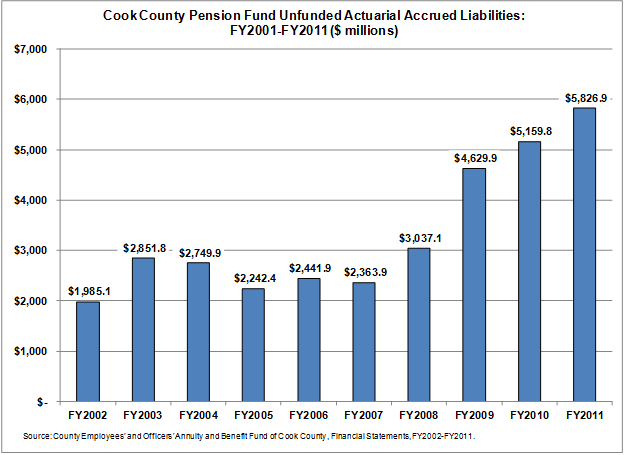
Unfunded actuarial accrued liabilities (UAAL) are those accrued liabilities not covered by actuarial assets. Unfunded liability is calculated by subtracting the actuarial value of assets from the actuarial accrued liability of a fund. The UAAL reflects investment gains and losses smoothed over a five-year period.
One of the functions of this indicator is to measure a fund’s ability to bring assets in line with liabilities. Healthy funds are ones that are able to reduce their unfunded liabilities over time; substantial and sustained increases in unfunded liabilities are cause for concern.
The unfunded actuarial liabilities of the Cook County Pension Fund increased by $3.8 billion between FY2002 and FY2011 to $5.8 billion. This represents a nearly 200% increase over the past 10 years and a 12.9% increase between FY2010 and FY2011 alone.
The largest contributor to the $3.6 billion growth in unfunded liabilities between the beginning of FY2005 and the end of FY2011 was investment returns failing to meet the 7.5% expected rate of return. This added nearly $2 billion to the UAAL. The second largest contributor was the shortfall in employer contributions as compared to the ARC, which added $1.6 billion to the unfunded actuarial accrued liability over seven years.
Investment Rate of Return
A pension fund invests the contributions of employers and employees in order to generate additional revenue over an extended period of time. Investment income provides the majority of revenue for an employee’s pension over the course of a typical career. The fund’s actuarial assumptions should be aligned with its investment policies in order to achieve appropriate risk and yield levels for the plan’s portfolio. Funds’ investment policies are validated by achieving their annualized risk adjusted rate of return on investments over time. The funds are required to report their assets at fair market value so investment income includes unrealized appreciation or depreciation over the time periods reflected. Because of this, investment income can show large fluctuations from year to year. Low or negative investment income usually causes a significant drop in pension fund assets, although this effect may be smoothed over time depending on the actuarial method of calculating assets.
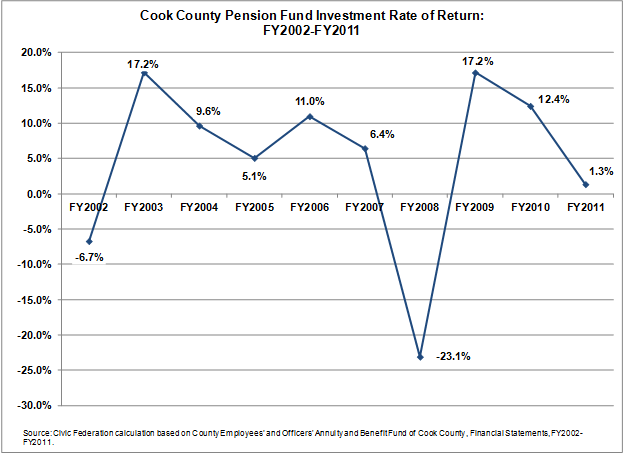
The Cook County Pension Fund assumes a 7.5% average annual rate of return on its pension investments for actuarial purposes. The fund’s actuary lowered the discount rate assumption from 8.0% to 7.5% in FY2004 after examining the fund’s investment experience from 2000-2003.
Between FY2002 and FY2011 the Cook County pension fund’s average annual rate of return was 5%.* Returns ranged from highs of 17.2% in FY2003 and FY2009 to a low of -23.1% in FY2008. The FY2011 return was 1.3%. According to data compiled by Pensions and Investments, the median 10-year annualized return for the 100 largest public pension funds in the nation that disclosed investment information was 5.6%, 2.24 percentage points below the average assumed rate of return for the funds. This indicates that, on average, the pension funds analyzed had a difficult time achieving their assumed rates of return over the past 10 years.
*Note: The Civic Federation calculates investment rate of return using the following formula: Current Year Rate of Return = Current Year Gross Investment Income/ (0.5*(Previous Year Market Value of Assets + Current Year Market Value of Assets – Current Year Gross Investment Income)). This is not necessarily the formula used by the pension fund’s actuary and investment managers, thus investment rates of return reported here may differ from those reported in a fund’s actuarial statements. However, it is a standard actuarial formula. Gross investment income includes income from securities lending activities, net of borrower rebates. It does not subtract out related investment and securities lending fees, which are treated as expenses.