
December 01, 2017
Each year the Civic Federation conducts an analysis of the CTA’s annual proposed budget. As part of the analysis, the Civic Federation uses two measures to assess CTA’s productivity over time: labor cost per actual unlinked passenger trip and operating expense per passenger mile.[1] The data used to calculate the productivity measures is obtained from the annual budget documents.
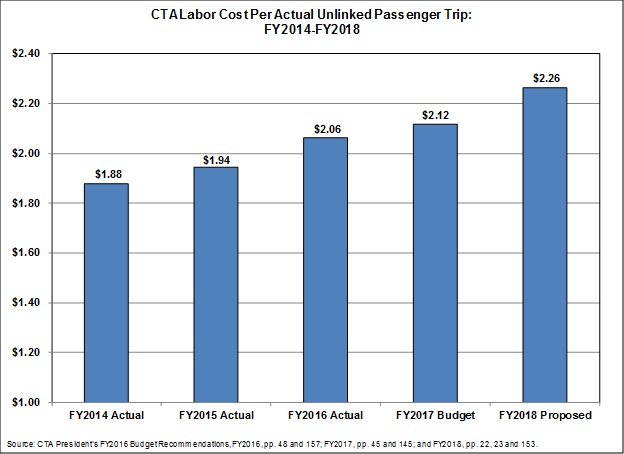
Productivity can be measured in terms of labor cost per unlinked passenger trip. A lower dollar amount indicates higher productivity. The labor cost per unlinked passenger trip indicator increased steadily from $1.88 in FY2014 to $2.26 in FY2018.
Between FY2014 and FY2018, productivity has declined because ridership, which fell by 2.6% on average each year, has not kept pace with labor costs, which grew by 2.0% on average each year. As a result, the ratio has steadily increased over the five-year period, rising from $1.88 in FY2014 to $2.26 projected in FY2018. The decrease in ridership was, according to the CTA, reportedly the result of extreme winter weather in FY2014 and FY2015, the continually increasing competition from alternative transit operations such as, Uber, Lyft, and Divvy, and low fuel prices in FY2016 and FY2017 which prompted increased car usage.[2] The labor cost per unlinked passenger trip is expected to increase between FY2017 and FY2018 by $0.14 from $2.12 to $2.26. This is due to a 0.4% decrease in labor costs compared to a 6.9% decrease in ridership over the previous year.
The proposed FY2018 budget is the first year since FY2010 where labor costs are projected to decrease from the year before. This is due to the elimination of 45 non-union positons and restricting hiring on an additional 70 positions.
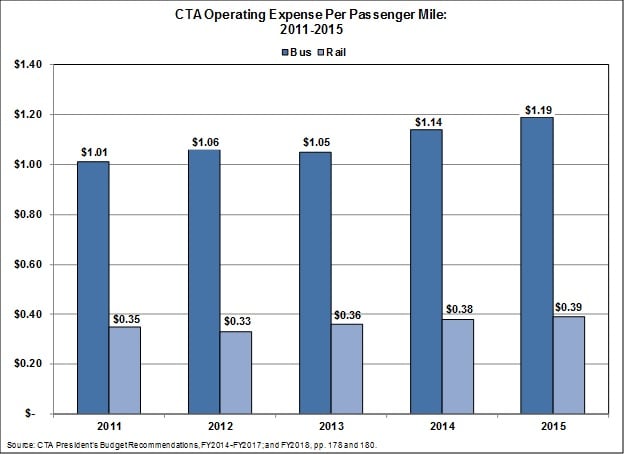
The chart below illustrates operating expense per passenger mile for bus and rail service between 2011 and 2015, the most recent years for which data is available. As with all transit systems, rail service is more cost effective than bus service because there is higher ridership on rail service. The operating expense per passenger mile for rail service has fluctuated only slightly over the past five years, declining from $0.35 in 2011 to $0.33 in 2012 before increasing to its highest point in 2015 at $0.39 per passenger mile.
The operating expense per passenger mile for bus service has increased by $0.18 over the last five years. It increased from a low of $1.01 in 2011 to $1.19 per passenger mile in 2015.
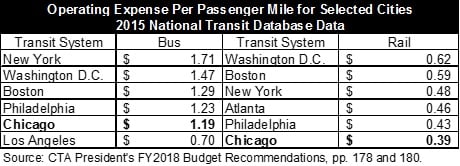
The table below shows Chicago’s operating expense per mile for bus and rail relative to its peer cities. Chicago’s rail system cost of $0.39 per passenger mile is the lowest among its peers and is $0.23 lower than the highest cost per passenger mile. Chicago’s bus system has a cost of $1.19 per passenger mile, which is $0.52 lower than the highest cost per passenger mile.
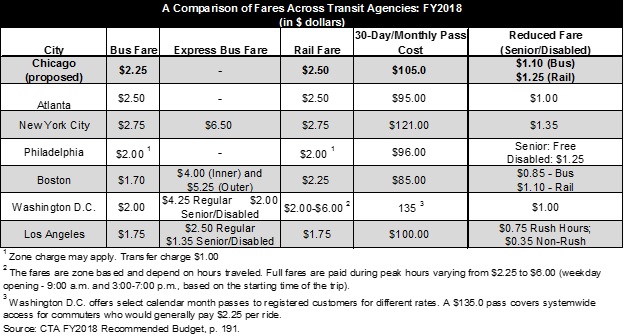
CTA is proposing to increase base fares in FY2018. The table below shows a comparison of CTA’s proposed fares to its peer cities. This is the first proposed general fare increase in nearly a decade. Bus fare would increase from $2.00 to $2.25, and rail fare would increase from $2.25 to $2.50. This will put CTA rail fare more in line with the fares charged by comparable urban rail systems. The proposed fare rate increase is expected generate nearly $23.0 million in additional revenue for the CTA in FY2018.
The Civic Federation will be releasing its full analysis of the Chicago Transit Authority’s FY2018 Recommended Budget in the coming weeks.