
October 15, 2021
The Civic Federation released its annual analysis of the City of Chicago’s proposed budget this week. Included in the report was a section dedicated to the budgetary impact of the City’s four pension funds and evaluating trends in their funded status. This blog post reproduces that chapter for readers who might not otherwise see it.
Pensions in the FY2022 City of Chicago Budget
The City of Chicago’s four pension funds are severely underfunded. A combination of statutory underfunding, benefit enhancements, investment losses, optimistic assumptions and other long-term problems have all contributed to their abysmal financial condition. Benefits for new employees were reduced in 2011 along with most other public pension plans in the State of Illinois, but subsequent attempts to reduce benefits for current employees in order to shore up the funds’ financial condition were struck down by the Illinois Supreme Court.[2] City and State leaders subsequently turned to changing statutory funding laws in an attempt to prevent the funds from becoming insolvent.
Since 2016 the City of Chicago’s four pension funds have been transitioned by State law to 40-year funding plans that start with five-year ramps of growing annual contributions set by state statute and a subsequent transition to a 35-year schedule of actuarially calculated contributions to increase their funded ratios to 90%. The Police and Fire funds started their ramps in FY2015 and transitioned to actuarially-calculated funding in FY2020 and the Municipal and Laborers’ funds started their ramps in FY2017 and will transition to actuarially-based funding in FY2022. Since all four funds in the future will be funded on an actuarially-calculated basis, annual contributions from the City will adjust according to the financial needs of the funds, but the length of the funding schedule and backloaded nature mean that the City will not make contributions sufficient to reduce the unfunded liability until the 2030s.[3]
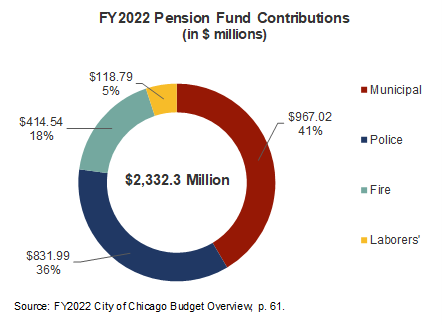
The FY2022 total contribution to the City’s four pension funds is $2.3 billion, as shown in the following chart. The two largest funds, the Municipal and Police Funds, receive the largest portion of the annual funding at 77% or nearly $1.8 billion.
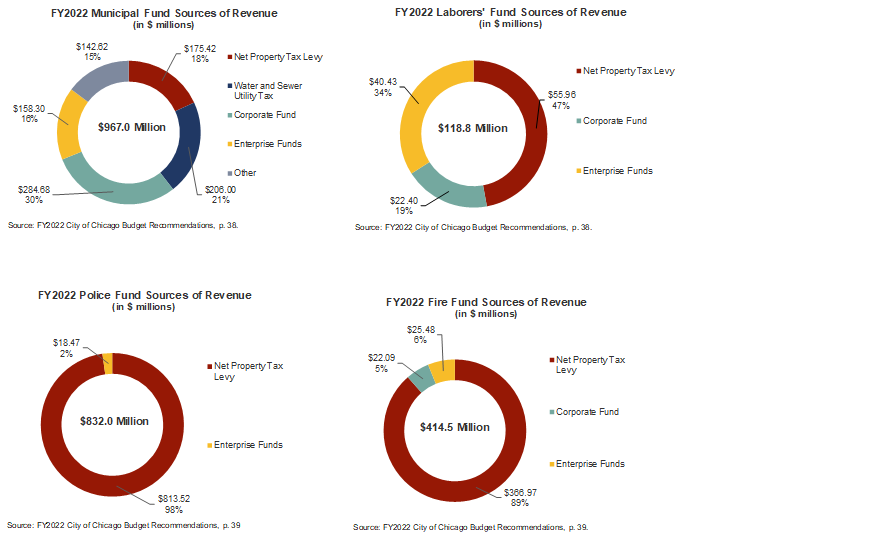
The City of Chicago uses several revenue sources to make its pension contributions: property taxes, contributions from the Corporate and Enterprise funds, a dedicated water and sewer tax for the Municipal Fund and other sources. The following charts show the breakdown of those sources for each fund. The property tax is the single largest source of revenue for the pensions at $1.4 billion or 60% of total pension funding.
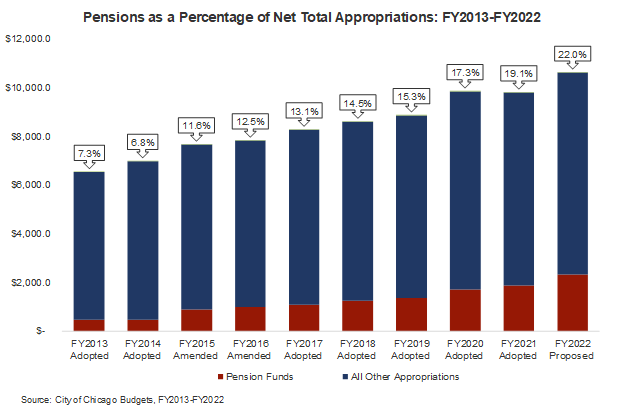
Prior to the implementation of the 40-year funding plans, the City’s pension funds were funded on a multiple of what employees contributed two years prior, which did not adjust according to each fund’s actuarial funding need. As shown in the following chart, prior to the transition of the funding schedule, pensions made up $478.3 million or 6.8% of the City’s spending in FY2014. However, the following year that increased to $885.7 million or 11.6% as the City started its ramps for the Police and Fire funds. The percentage of the budget going to pensions has increased over the following years to 22.0% in FY2022.[4]
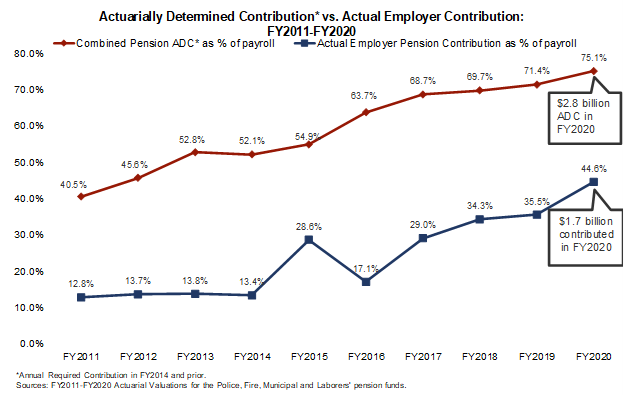
In order to analyze how far short of sufficient past years’ contributions have been, it is useful to compare the City’s actual contributions to an objective measure of how much the City would need to contribute in order to pay off its unfunded liability over a set period of time. That measure, the Actuarially Determined Contribution (ADC), is a reporting requirement of the Governmental Accounting Standards Board and is reported in each pension fund’s annual actuarial reports.[5]
The following chart compares the City’s statutory contribution to its four pension funds as a percentage of payroll to the ADC as a percentage of payroll. The spread between the two amounts grew from a shortfall in FY2011 of 27.8 percentage points, or $905.1 million, to a gap of 38.7 percentage points in FY2014, before falling to a gap of 26.2 percentage points in FY2015, due to higher employer contributions for the Police and Fire Funds. The gap increased again in FY2016 to 46.6 percentage points due to the City decreasing its contributions that year to make up for over-contributions in FY2015. The shortfall improved over the next several years to 30.5% in FY2020 or $1.1 billion. In other words, to fund the pension plans at a level that would both cover normal cost and amortize the unfunded liability over 30 years, the City would have needed to contribute an additional 30.5% of payroll, or $1.1 billion, in FY2020.
In FY2020 there were 50,898 employees participating in the four pension funds. The Municipal Fund constitutes 61.0% of total active employee membership. However, roughly half of the 31,051 active Municipal Fund members are not City employees, but rather are non-teacher employees of Chicago Public Schools. Approximately 57.9% of all active members of all four pension funds belong to Tier 1 and 42.1% belong to Tier 2 or 3. The Municipal Fund has the highest percentage of non-Tier 1 members with approximately 46.7% and the Laborers’ Fund has the lowest with approximately 30.5%.
The following chart shows the percentage of active members in each fund.
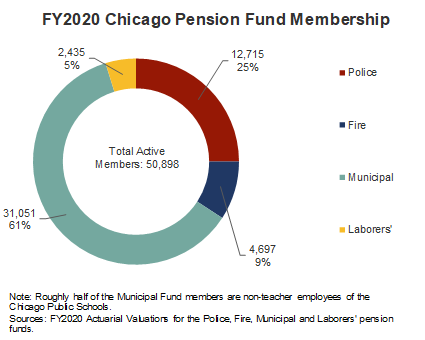
Every fund except the Municipal Fund has more annuitants and beneficiaries than active employees. The ratio of actives to annuitants ranges from 0.65 in the Laborers’ Fund to 0.90 and 0.91 for the Fire and Police Funds to 1.21 for the Municipal Fund. A low ratio of active employees to annuitants means there are fewer employees paying into the fund and more retirees taking annuity payments out of the fund and can be a signal of distress for a mature and underfunded pension like the four Chicago funds.
Funding Status of the City of Chicago’s Pensions
In addition to evaluating whether an employer is contributing enough to the pension fund through a comparison to the ARC, it is important to understand how well-funded a pension plan is and whether funding is improving or declining over time. Pension fund status indicators show how well a pension fund is meeting its goal of accruing sufficient assets to cover its liabilities. Ideally, a pension fund should hold exactly enough assets to cover all of its actuarial accrued liabilities.
The Civic Federation analyzes three measures over time to evaluate funding status:
- Funded ratio;
- Unfunded actuarial accrued liabilities; and
- Investment rate of return.
Funded Ratio: The most basic indicator of pension fund status is its ratio of assets to liabilities, or “funded ratio.” In other words, this indicator shows how many pennies of assets a fund has per dollar of liabilities. For example, if a plan had $100 million in liabilities and $90 million in assets, it would have a 90% funded ratio and about 90 cents in assets per dollar of obligations to its employees and retirees.
When a pension fund has enough assets to cover all its accrued liabilities, it is considered 100% funded. This does not mean that further contributions are no longer required. Instead it means that the plan is funded at the appropriate level at a certain date. A funding level under 100% means that a fund does not have sufficient assets on the date of valuation to cover its actuarial accrued liability.
Unfunded Liability: Unfunded actuarial accrued liabilities (UAAL) are obligations not covered by assets. Unfunded liability is calculated by subtracting the value of assets from the actuarial accrued liability of a fund. For example, if a plan had $90 million in assets and $100 million in liabilities, its unfunded liability would be $10 million.
One of the purposes of examining the unfunded liability is to measure a fund’s ability to bring assets in line with liabilities. Healthy funds are able to reduce their unfunded liabilities over time. On the other hand, substantial and sustained increases in unfunded liabilities are a cause for concern.
Investment Rate of Return: A pension fund invests the contributions of employers and employees in order to generate additional revenue over an extended period of time. Investment income provides the majority of revenue for an employee’s pension over the course of a typical career. In addition to the actual annual rate of return, the assumed investment rate of return plays an important role in the calculation of actuarial liabilities. It is used to discount the present value of projected future benefit payments and has been the subject of considerable debate in recent years.[6] The assumed rate of return for the four Chicago pension funds ranges from 6.75% for the Police and Fire funds to 7.0% for the Municipal Fund and 7.25% for the Laborers’ Fund.
Other major contributors to a pension fund’s financial status in addition to employer contributions and investment returns are benefit enhancements and changes to actuarial assumptions. In past years, the funds’ reductions to their expected rate of return on investment has been a major source of increases to the unfunded liability. In 2021 a major benefit enhancement for Chicago firefighters was enacted in Springfield that extended a larger automatic annual increase to annuities to younger firefighters. The effective date of Public Act 101-0673 was April 5, 2021 and the changes will be accounted for in the FY2021 actuarial valuation.[7]
Funded Ratio
This section uses two measurements of pension plan funded ratio: the actuarial value of assets measurement and the market value of assets measurement. These ratios show the percentage of pension liabilities covered by assets. The lower the percentage, the more difficulty a government may have in meeting future obligations.
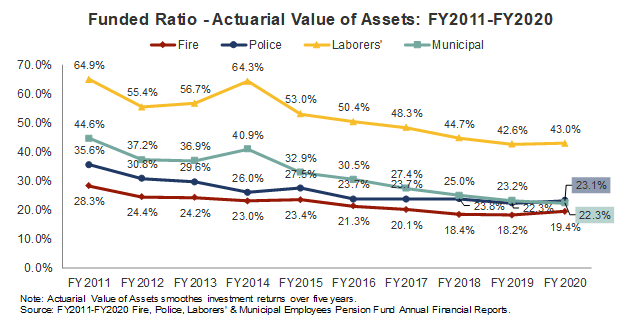
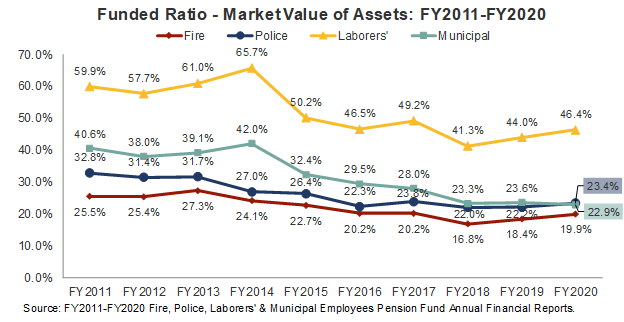
The actuarial value of assets measurement presents the ratio of assets to liabilities and accounts for assets by recognizing unexpected gains and losses smoothed out over a period of three to five years.[8] The market value of assets measurement presents the ratio of assets to liabilities by recognizing investments only at current market value. Market value funded ratios are more volatile than actuarial funded ratios due to the smoothing effect of actuarial value. However, market value funded ratios represent how much money is actually available at the time of measurement to cover actuarial accrued liabilities.
The following exhibit shows actuarial value funded ratios for each of the four pension funds. The actuarial value funded ratios for three of the four City pension funds increased in FY2020. The Fire Fund increased to 19.4%, the Police Fund increased to 23.1% and the Laborers’ Fund rose to 43.0%, but the Municipal Fund decreased to 23.3%.
The following exhibit shows market value funded ratios for each of the four pension funds. The market value funded ratios have fluctuated since FY2011, but generally shown a downward trend as liabilities have increased due predominantly to insufficient employer contributions and changes to actuarial assumptions and the funds have experienced periodic investment losses. The same three funds’ market value funded ratios increased in FY2020 due to high investment returns, while the Municipal Fund’s market funded ratio fell because of insufficient employer contributions.
Unfunded Actuarial Accrued Liability
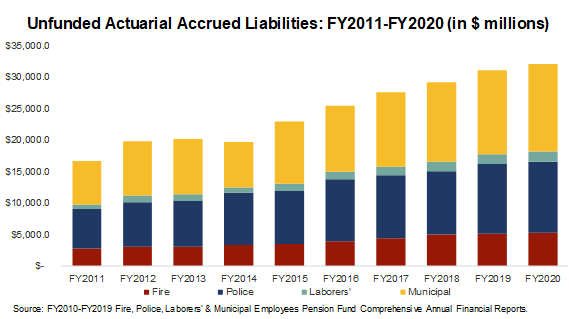
Over the past ten years, the unfunded liabilities of the four pension funds combined have grown by $15.3 billion, or 91.6%. This was an increase from $16.7 billion in FY2011. The total unfunded liabilities of the four funds increased to $32.0 billion in FY2020 from $31.0 billion in FY2019, or by 3.17%.
A summary of the ten-year changes in unfunded liabilities by fund is shown below:
- Fire Pension Fund: 89.3% increase, or $2.5 billion;
- Police Pension Fund: 81.0% increase, or $5.1 billion;
- Laborers’ Pension Fund: 102.9% increase, or $791.3 billion; and
- Municipal Pension Fund: 100.9% increase, or $7.0 billion.
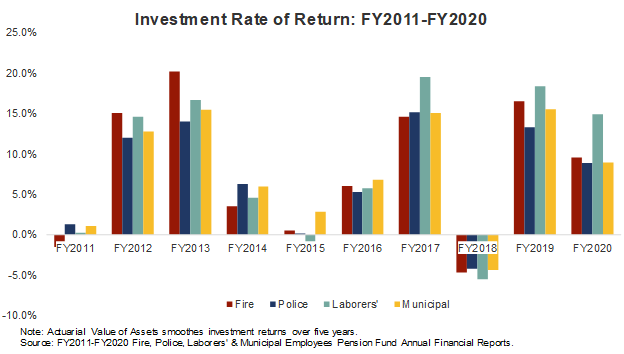
Investment Return
In FY2020 all four City pension funds experienced returns greater than their expected rates of return on their investments, ranging from 8.9% for the Police Fund to 14.9% for the Laborers’ Fund.[9] As noted above, the FY2020 investment assumption for the Police Fund was 6.75%, the Fire Fund rate of return was 6.75%, the Laborers’ Fund was 7.25% and the Municipal fund was 7.0%.
[1] See for example Civic Federation, “City of Chicago Proposed Budget: Analysis and Recommendations,” November 16, 2020, pp. 68-73. Available at https://www.civicfed.org/ChicagoFY2021.
[2] For more information see https://www.civicfed.org/civic-federation/blog/chicago-pension-reforms-struck-down-illinois-supreme-court.
[3] See Fund Actuarial Valuations, 50-year funding projections.
[4] For a historical and projected pension contribution chart, see City of Chicago, 2022 Budget Overview, p. 60. Available at https://www.chicago.gov/content/dam/city/depts/obm/supp_info/2022Budget/2022OverviewFINAL.pdf
[5] To read more about the Actuarially Determined Contribution and how it is similar and differs from a previous measure, the Annual Required Contribution (ARC), see the Appendix.
[6] For a short description of the debate see Thomas J. Healey, “Commentary: A note on the discount rate,” Pensions and Investments, October 8, 2019. Available at https://www.pionline.com/industry-voices/commentary-note-discount-rate.
[7] Public Act 101-0673, https://ilga.gov/legislation/publicacts/101/PDF/101-0673.pdf. See also Firemen’s Annuity and Benefit Fund of Chicago Actuarial Valuation and Review as of December 31, 2020, p. 10. Available at https://www.fabf.org/PDF/Financial/ActuarialValuation/Segal12-31-2020.pdf.
[8] For more detail on the actuarial value of assets, see Civic Federation, Status of Local Pension Funding FY2012, October 2, 2014.
[9] The Civic Federation calculates investment rate of return using the following formula: Current Year Rate of Return = Current Year Gross Investment Income/ (0.5*(Previous Year Market Value of Assets + Current Year Market Value of Assets – Current Year Gross Investment Income)). This is not necessarily the formula used by the pension funds’ actuaries and investment managers; thus investment rates of return reported here may differ from those reported in a fund’s actuarial statements. However, it is a standard actuarial formula. Gross investment income includes income from securities lending activities, net of borrower rebates. It does not subtract out related investment and securities lending fees, which are treated as expenses.