
October 08, 2014
An analysis this week released by the Civic Federation uses 13 indicators of financial condition to provide a snapshot of the fiscal health of four Chicago charter schools or networks between fiscal years 2007 and 2011. The analysis indicated strong fiscal health for the Lawndale Regional and Educational Network (LEARN) and Namaste Charter School. Results for the North Lawndale and UNO charter schools were mixed, with several negative trends that could impair long-term fiscal viability. Click here to read the full 95-page report.
The analysis was planned as the first in a two-part study on the factors needed to ensure the long-term viability of Chicago charter schools. The second portion of the study was to have been a qualitative analysis including a review of key plans for board development, strategic plans, fundraising plans, capital improvement plans and long-term plans, as well as recommendations for improvement. A lack of cooperation from the charter schools made it impossible to complete the second portion of this study.
Without cooperation, the Civic Federation was only able to complete a quantitative analysis using financial information from individual charter school websites and audited financial reports for fiscal years 2007-2011. Each section of the quantitative analysis is intended as a stand-alone report on the fiscal health of the selected Chicago charter school or network between FY2007 and FY2011. The 13 indicators in the report represented three categories of analysis.
The following fiscal trend analysis indicators examined the percentage of each charter school’s resources spent on instruction-related expenses versus administrative expenses:
- The Program Expense Ratio measures the relationship between program expenses and the organization’s total expenses;
- The Instructional Expense Analysis compared charter expenses in five categories: Instruction, Pupil Support Services, Administrative Support Services, Facilities and Other; and
- The Spending on Instruction and Pupil Support Services metric combined two categories of spending to provide an overview of total classroom-related or education-related expenses.
The following financial condition analysis indicators evaluated available resources and liquidity:
- The Year-End Balance reported whether or not each school had a deficit or a surplus in a given year;
- The Fund Balance Ratio is a measure of resources available to use for emergencies or contingencies; and
- The Current Ratio is a measure of liquidity.
The following financial performance analysis indicators are commonly used in the private, public and nonprofit sectors to measure an organization’s overall ability to meet financial obligations:
- The Fixed Assets Ratio measures how much of an organization’s total assets are fixed assets and how much flexibility the organization has to fund service demands;
- The Capitalization Ratio indicates the relative proportion of capital or net assets that can be used to finance new assets;
- The Debt-to-Worth Ratio evaluates the degree to which an organization can use debt to finance asset acquisition;
- The Occupancy Ratio is a measure of how much of total revenues are consumed by the costs of occupying and maintaining school facilities;
- The Instruction Ratio measures how much of a school’s gross revenues are used to pay for personnel related costs;
- For these nonprofit organizations, the Profit Margin Ratio is an indicator of whether the charter school maintains reasonable reserves that can be used to generate earnings to expand their capital base; and
- The Days of Cash on Hand measure compares cash and marketable securities with daily operating expenses.
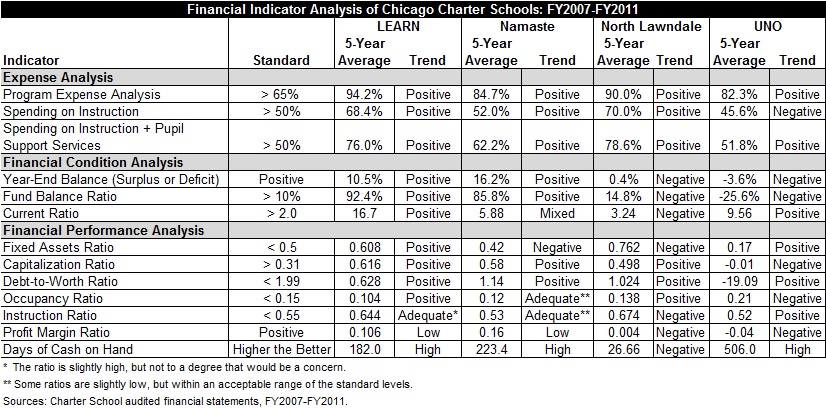
As shown in the summary chart below, the LEARN charter school was in good fiscal health during the five-year period, with 12 positive indicators and one adequate indicator. The fiscal health of Namaste charter school was mostly positive with eight positive indicators, four mixed indicators and one negative indicator. The trend analysis for North Lawndale charter school showed mixed results with six positive indicators and seven negative indicators. UNO charter school also experienced mixed fiscal health during the period, with seven positive indicators and six negative indicators.
While this report provides general insights into the charter schools’ financial situation, it is important to note that these trends are often driven by extenuating circumstances. A full evaluation of these circumstances is beyond this scope of this analysis, but was intended for the second part of the study that the Civic Federation cannot complete without cooperation from the charter schools. There were also significant data limitations in preparing this part of the report because charter schools are not required to report revenue or expense information in a consistent manner. The Civic Federation continues to urge the Illinois General Assembly to require greater financial accountability from both public and charter schools.
The Civic Federation gratefully acknowledges the Searle Funds at The Chicago Community Trust for a generous grant that made the research and writing of this report possible.