

November 12, 2026
Paula R. Worthington
As Illinois approaches the next stage of its budget process, the Governor’s Office of Management and Budget will release its annual economic and fiscal policy report, including updated FY2028 and five-year projections. This Civic Federation update examines the economic conditions that will shape those forecasts—and the budget choices ahead.
The central finding is mixed but important: Illinois’s economy has performed better than earlier data suggested, and its credit ratings continue to improve. Yet employment growth remains weak, as the fastest growing sectors are not the ones adding jobs. Furthermore, pension obligations are substantial, and reserves provide limited protection against new fiscal pressures.
The distinction matters for the FY2028 budget. Stronger measured economic growth is welcome, but it does not erase the State’s long-standing fiscal constraints or the uncertainty surrounding federal policy changes under H.R. 1.
Two important improvements
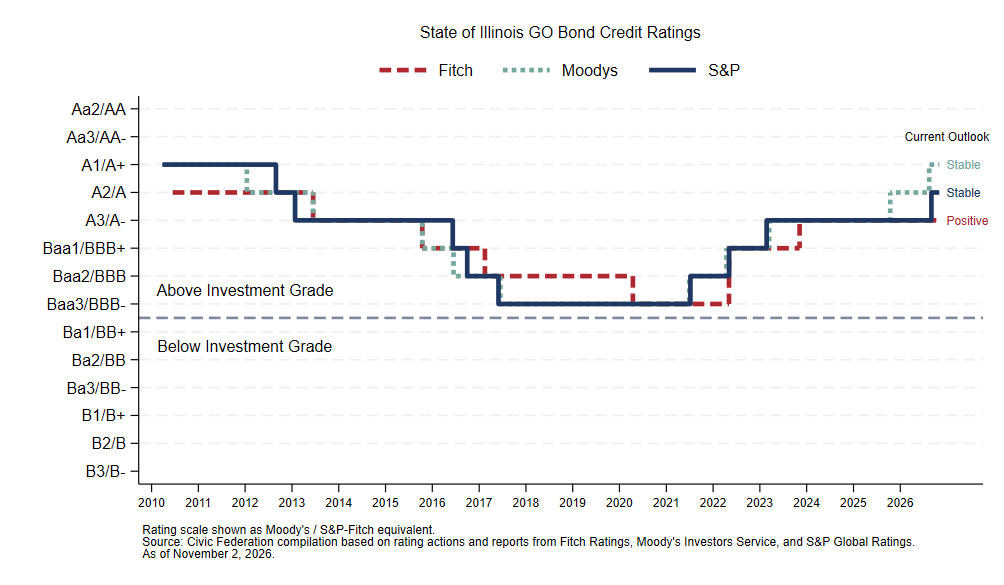
Illinois’s credit ratings continue to recover from their pre-COVID lows, when ratings agencies penalized the State for its failure to pass budgets, accumulation of unpaid bills, and operational borrowing.1 S&P Global Ratings raised the State’s general obligation rating from A− to A, with a stable outlook, on September 1, 2026, following Moody’s August 26 upgrade from A2 to A1, also with a stable outlook. Ratings from S&P, Moody’s, and Fitch are now comfortably above the investment-grade threshold, as the chart shows. Nevertheless, Illinois remains the lowest-rated state by S&P’s measure and continues to face higher borrowing costs than top-rated issuers. In mid-June 2026, before the latest upgrades, the yield on its 10-year GO bonds was approximately 62 basis points above the AAA benchmark.
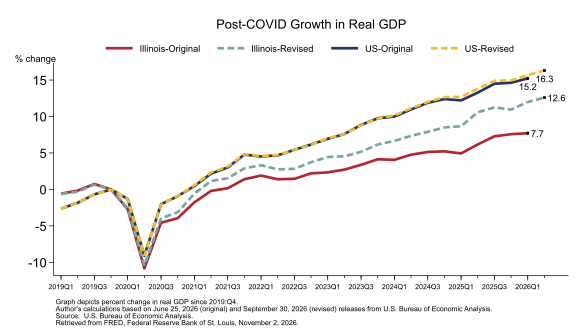
Revised GDP estimates provide a second reason for optimism. The Bureau of Economic Analysis’s September 2026 revisions show that Illinois’s post-COVID recovery was substantially stronger than previously estimated. For the period from 2018:Q1 to 2026:Q1, Illinois’s annualized real GDP growth rate was 0.40% after revisions, up from only 0.27% based on earlier estimates. That moved Illinois from the seventh-lowest growth rate nationally to the seventeenth-lowest—and ahead of Great Lakes region neighbors Wisconsin and Michigan.2
The change is especially striking in the post-COVID comparison below. Illinois’s real GDP has grown by well over 12% since 2019:Q4, compared with under 8% in the earlier estimates. Even after the revision, however, Illinois trails the nation’s revised 16.3% growth.
Why the GDP revision was especially large in Illinois
The GDP revisions were not evenly distributed across industries. Finance and insurance, wholesale trade, and nondurable goods manufacturing received sizeable upward revisions to their estimated contributions to growth. Because these sectors account for a larger share of Illinois’s economy than of the national economy, the changes had an outsized effect on Illinois’s GDP estimates. For example, Finance and Insurance alone represents 11.0% of Illinois GDP, versus 8.7% nationally. Its estimated contribution to Illinois growth in 2023 increased from 0.1 to 1.0 percentage point, as shown below.3
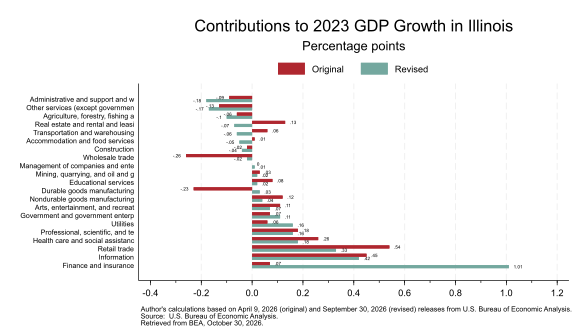
As a result, Illinois experienced the fourth-largest upward revision in GDP growth among the 50 states. The revision was generally smaller in other Great Lakes states, where the industries most affected have different weights in the economy.
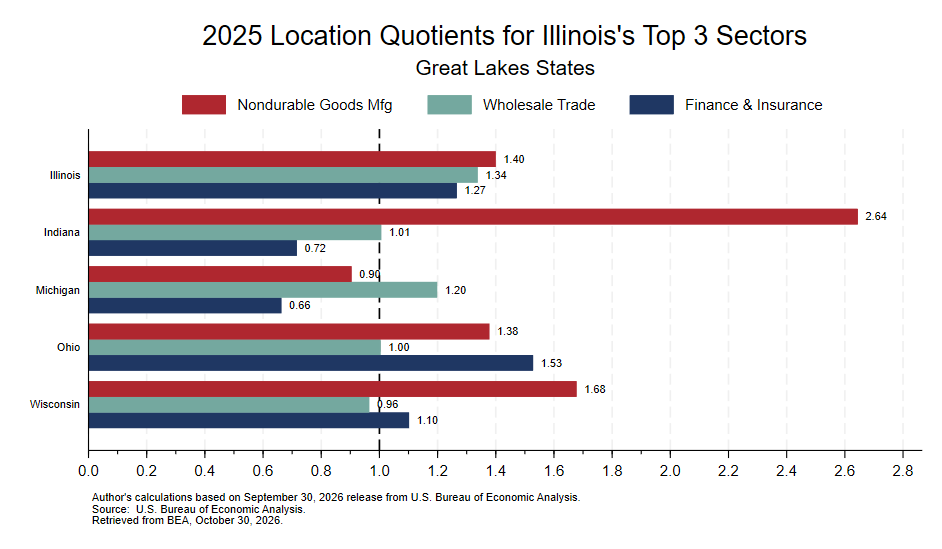
The next chart compares Illinois with its Great Lakes peers using GDP-based location quotients (LQs)—a measure of how prominent an industry is in a state relative to the nation. Illinois has an LQ of 1.27 for finance and insurance, meaning that sector’s GDP share is 27% higher than its national share. Illinois also has above-average concentrations in wholesale trade and nondurable goods manufacturing.4
The regional contrasts help explain the differing revisions. Indiana and Wisconsin are more concentrated in nondurable goods manufacturing but less concentrated in finance and insurance. Michigan is below the national average in two of the three sectors. Ohio has a broadly similar industrial mix, but its annualized growth rate was revised upward by only 0.02 percentage point.
The takeaway: the revised data meaningfully improve Illinois’s growth record and its standing relative to nearby states, without changing the fact that national growth has been stronger.
The continuing weakness: jobs
The improved GDP picture should not obscure the weakness of Illinois’s labor market. While national figures remain surprisingly strong, Illinois has not kept pace.
- Nationally, the October jobs report showed a 4.1% unemployment rate and an increase of 165,000 nonfarm payroll jobs, with an average monthly gain of 137,000 over the preceding three months.
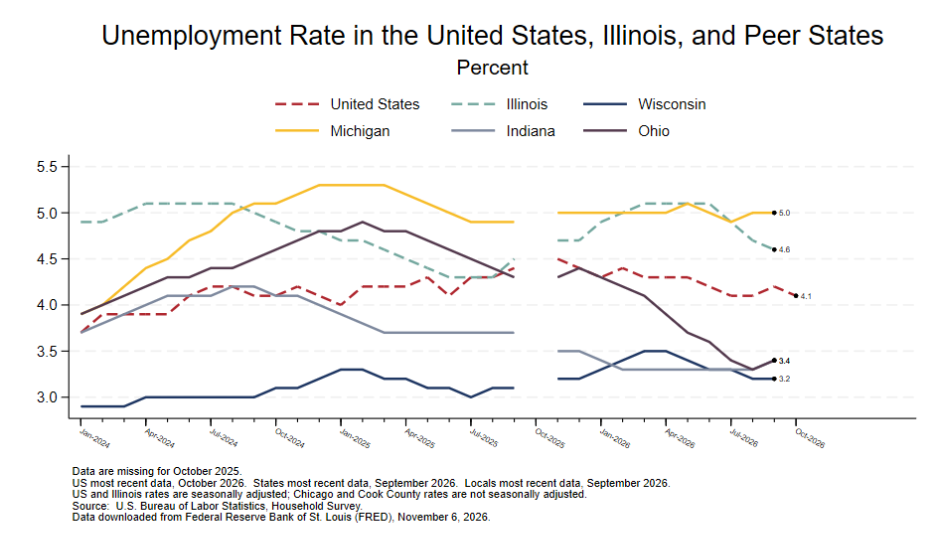
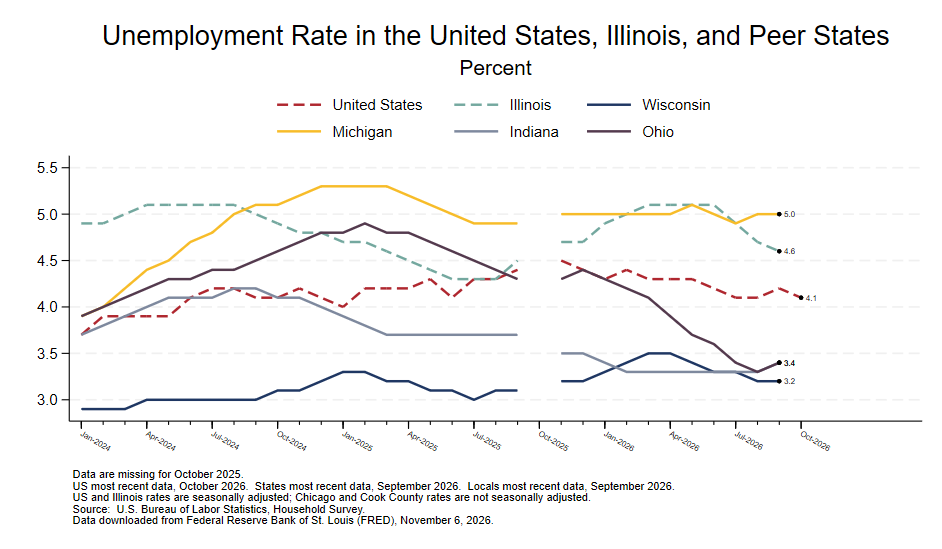
- Illinois’s unemployment rate was 4.6% in September 2026, the latest available month—above the national average and higher than its Midwest neighbors except for Michigan.
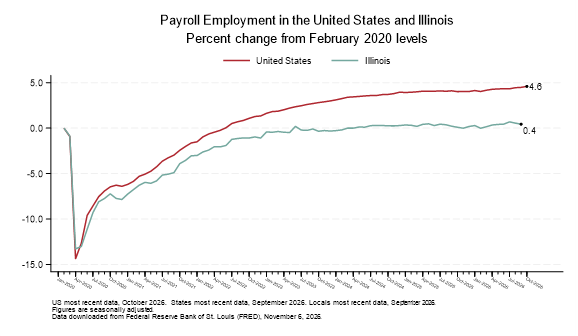
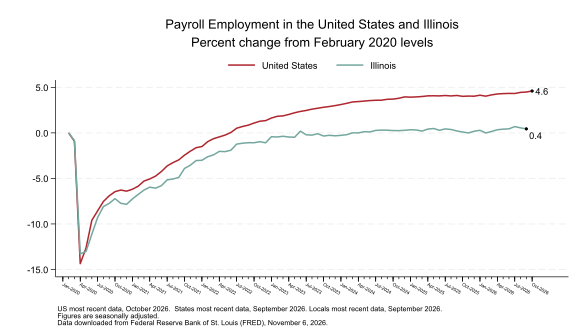
- Nonfarm payroll employment in Illinois in September 2026 was just 0.4% above February 2020 levels, compared with 4.6% nationally through October. The chart below illustrates the persistent gap in the employment recovery.
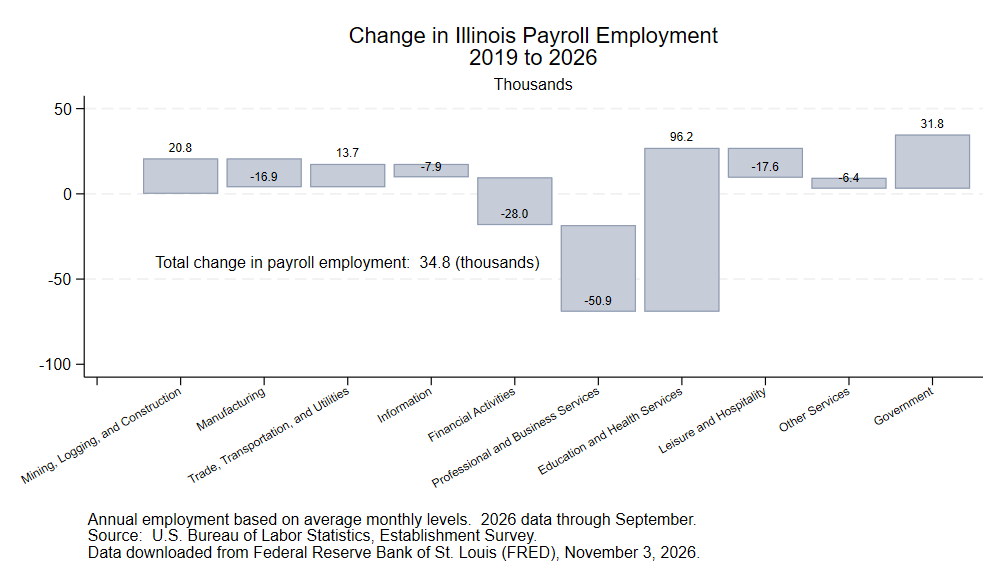
Illinois’s job gains have also been concentrated in a few sectors. Education and health services and government have provided the largest increases since 2019, while financial activities lost jobs despite the sector’s substantial contribution to GDP. This latter point deserves further explanation: finance and related activities can generate substantial value added with relatively few employees.5 More broadly, growth in economic output need not translate into comparable growth in payroll jobs.
What this means for the FY2028 budget
Illinois enters budget season with genuine advantages: a stronger revised GDP record, improved credit ratings, and better-than-expected tax receipts so far in FY2027, according to the Commission on Government Forecasting and Accountability. These developments offer some near-term breathing room.
But they do not resolve the State’s structural challenges. Unfunded pension liabilities continue to require large annual contributions and constrain other priorities. Rainy-day reserves have grown substantially from near-zero levels but remain below commonly recommended standards, limiting the State’s capacity to absorb adverse shocks: these funds are enough to cover only 16.2 days of general funds spending, the 3rd lowest figure in the country.
Federal policy adds another layer of risk. Changes enacted under P.L. 119-21 (H.R. 1) affect state revenues, expenditures, and safety-net programs, creating new budget pressures and uncertainty for vulnerable populations. Congress may revisit some provisions, but the timing and scope of any changes remain uncertain.
The bottom line is that Illinois’s improved economic record is encouraging, not a substitute for fiscal planning. As FY2028 projections take shape, the Civic Federation will continue to monitor economic conditions, revenue trends, pension costs, reserves, and the State-level consequences of federal policy changes.
References
1Ratings downgrades of 2016-2017 were responses to the State’s failure to pass a budget, pay bills on time, and limit political conflicts between the executive and legislative branches.
2On September 30, 2026, the U.S. Bureau of Economic Analysis released its annual data revisions to its National and Regional Economic Accounts for the 2018:Q1-2026:Q1 period.
3The BEA regularly revises its National Income and Regional Economic Accounts. Three key factors typically drive revised state-level estimates: updates to partial and preliminary data sources; revisions to revised national estimates; and changes to concepts and methods used. By making regular revisions to reflect better data and methods, the BEA aims to provide a consistent and accurate picture of the US economy.
4The location quotient for industry i is defined as LQi,IL= GDPi,IL/GDPILGDPi,US/GDPUSLQi,IL= GDPi,IL/GDPILGDPi,US/GDPUS
5We note that FIRE represents a greater share of jobs in Illinois (6.2%) relative to the nation as a whole (5.7%). But FIRE represents smaller shares of jobs than it does GDP.