
September 23, 2025
The Civic Federation’s Local Pension Dashboard is intended for use as a resource and educational tool to increase the accessibility of local pension fund data. The dashboard reports metrics for the ten major local pension funds within the City of Chicago and Cook County, Illinois, with data from 1996 to 2024 (2024 CTA data is not included as that data has not been released as of publication). Using this tool, dashboard users can create custom visualizations and comparisons of up to ten funds.
The ten local pension funds included in this dashboard are:
- Fireman’s Annuity and Benefit Fund (Chicago Fire)
- Policeman’s Annuity and Benefit Fund (Chicago Police)
- Laborers' & Retirement Board Employees' Annuity & Benefit Fund (Chicago Laborers)
- Municipal Employees' Annuity & Benefit Fund (Chicago Municipal)
- Park Employees’ Annuity and Benefit Fund (Chicago Park District)
- Retirement Plan for Chicago Transit Authority Employees (Chicago Transit)
- Teachers’ Pension and Retirement Fund (Chicago Teachers)
- Metropolitan Water Reclamation District Retirement Fund (MWRD)
- Forest Preserve District Employees’ Annuity and Benefit Fund of Cook County (Forest Preserve)
- County Employees’ and Officers’ Annuity Benefit Fund of Cook County (Cook County)
The dashboard tracks six key metrics for each of the ten funds:
1. Unfunded Actuarial Accrued Liabilities;
2. Funded Ratio;
3. Investment Rate of Return;
4. Funding Shortfall between the Actuarially Determined Contribution and the Actual Employer Contribution;
5. Average Annual Benefit; and
6. Fund Membership.
The first three metrics, Unfunded Actuarial Accrued Liabilities, Funded Ratio by Actuarial Value of Assets, and Investment Rate of Return, are measures commonly used to evaluate a pension fund’s overall performance and fiscal health. This dashboard also includes national average data for the Funded Ratio and Investment Rate of Return metrics as a point of comparison for local fund performance. The Funding Shortfall displays the difference between a pension fund’s Actuarially Determined Contribution and the actual contributions made to the fund by the employer in a given year. The Average Annual Benefit and Fund Membership metrics provide additional summary information to illustrate changes in fund membership and benefits over time. (See: Glossary for in-depth definitions for each metric and additional relevant terminology).
Source Data
Unless otherwise noted, all pension fund data contained within this dashboard is taken from the annual actuarial valuations and financial statements for each fund from 1996 through 2024. Note that CTA pension fund data is not yet available for 2024. This data is collected and updated by Civic Federation staff on an annual basis. National average data for the Funded Ratio and Investment Rate of Return is from the Center for Retirement Research at Boston College Public Plans Data (2001-2023).
User Guidance
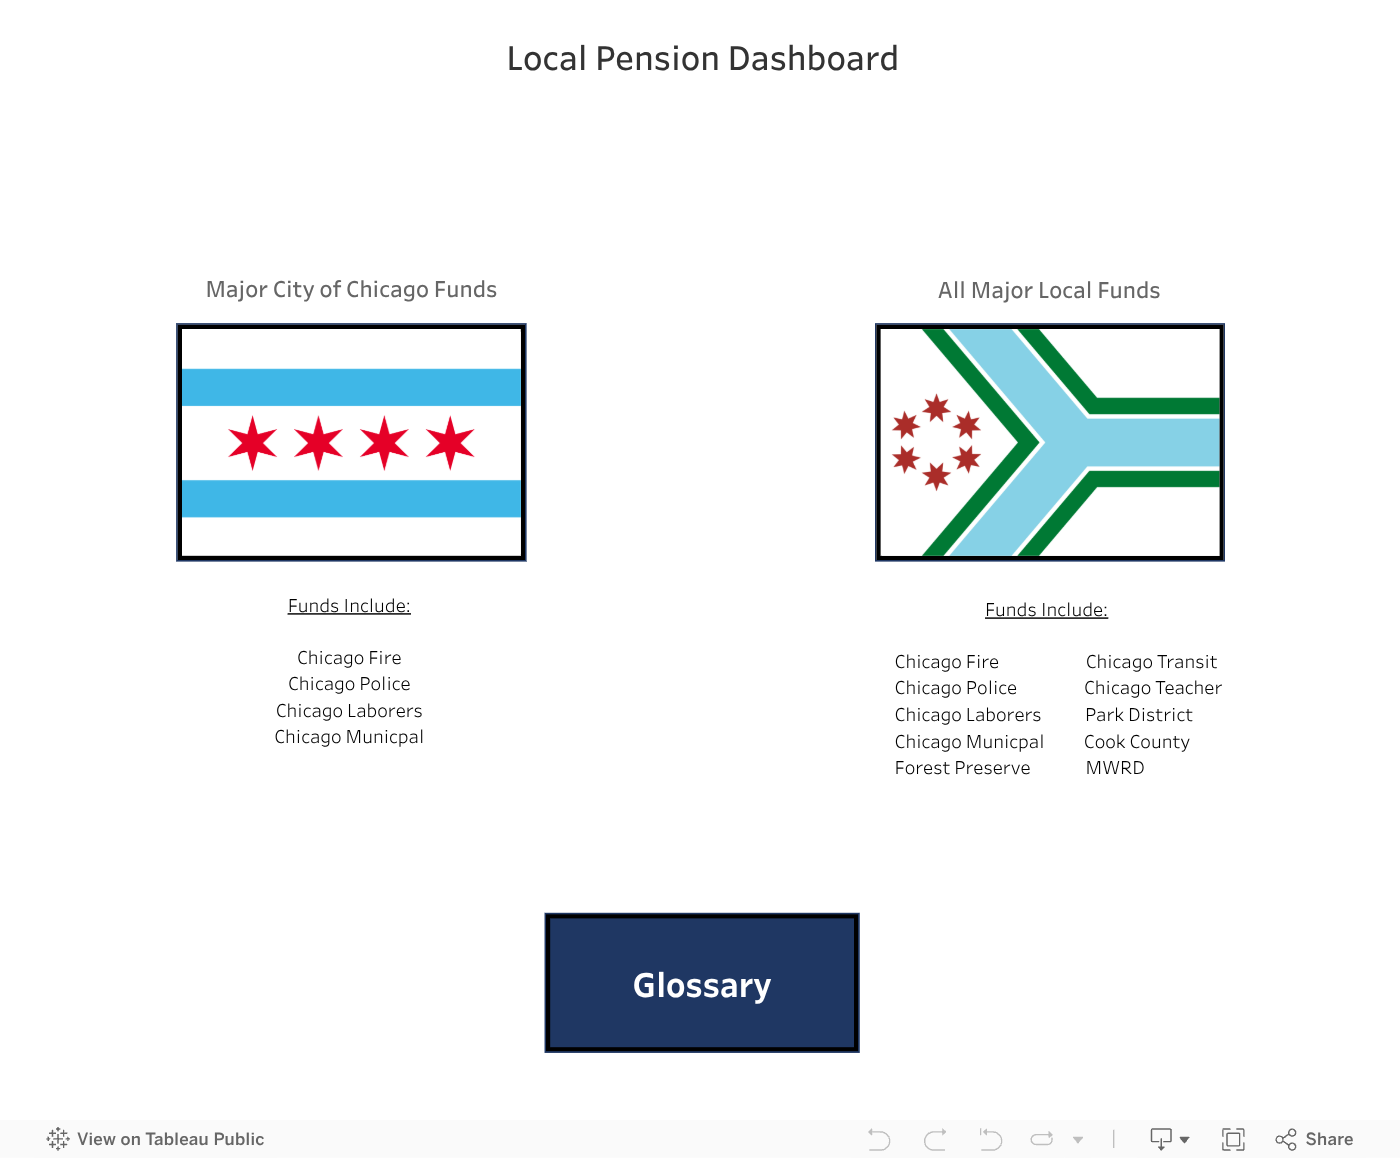
The dashboard groups the data into two different views: 1) The four City of Chicago pension funds; and 2) all 10 major local pension funds. Click on either of the two views via the flags below to see the pension metrics. From there, you can filter to select the specifics years and pension funds that you would like to view or compare. Click on the red boxes to navigate to other metrics or click on “Return to Dashboard Home” to return to the main screen.
For questions or feedback on this dashboard, please email [email protected].