
November 23, 2022
This blog examines online reporting of American Rescue Plan Act (ARPA) spending and performance measures by major U.S. cities. A key component of ARPA was a $350 billion infusion of federal funding to state, local and Tribal governments nationwide to support their pandemic recovery through the Coronavirus State and Local Fiscal Recovery Funds (SLFRF). The U.S. Department of Treasury outlined permissible uses of SLFRF funds, including replacement of lost revenues, addressing negative economic and public health impacts, additional supports and premium pay to essential workers, and investments in infrastructure for water, sewer and broadband.
Recipients of SLFRF funds are subject to several compliance and reporting guidelines, which the Treasury Department outlined in a published guide. For metropolitan cities with a population exceeding 250,000, the reporting guidelines are as follows:
- An initial Interim Report with expenditures by category (due last year);
- Quarterly and Annual Project and Expenditure Reports; and
- Annual Recovery Plan Performance Updates.
Most major U.S. cities are making this information publicly available in some capacity, and many cities have employed online dashboards as a user-friendly mechanism for transparency. These dashboards are supplemental to the required reports listed above. However, they do offer an important medium to provide the general public a level of engagement in what cities are doing with their respective ARPA resources and they can also be linked to and used as part of their performance reporting. This blog will examine the early reporting trends from major U.S. cities in relation to online city ARPA dashboard performance reporting while noting interesting and replicable components.
Chicago ARPA Dashboard
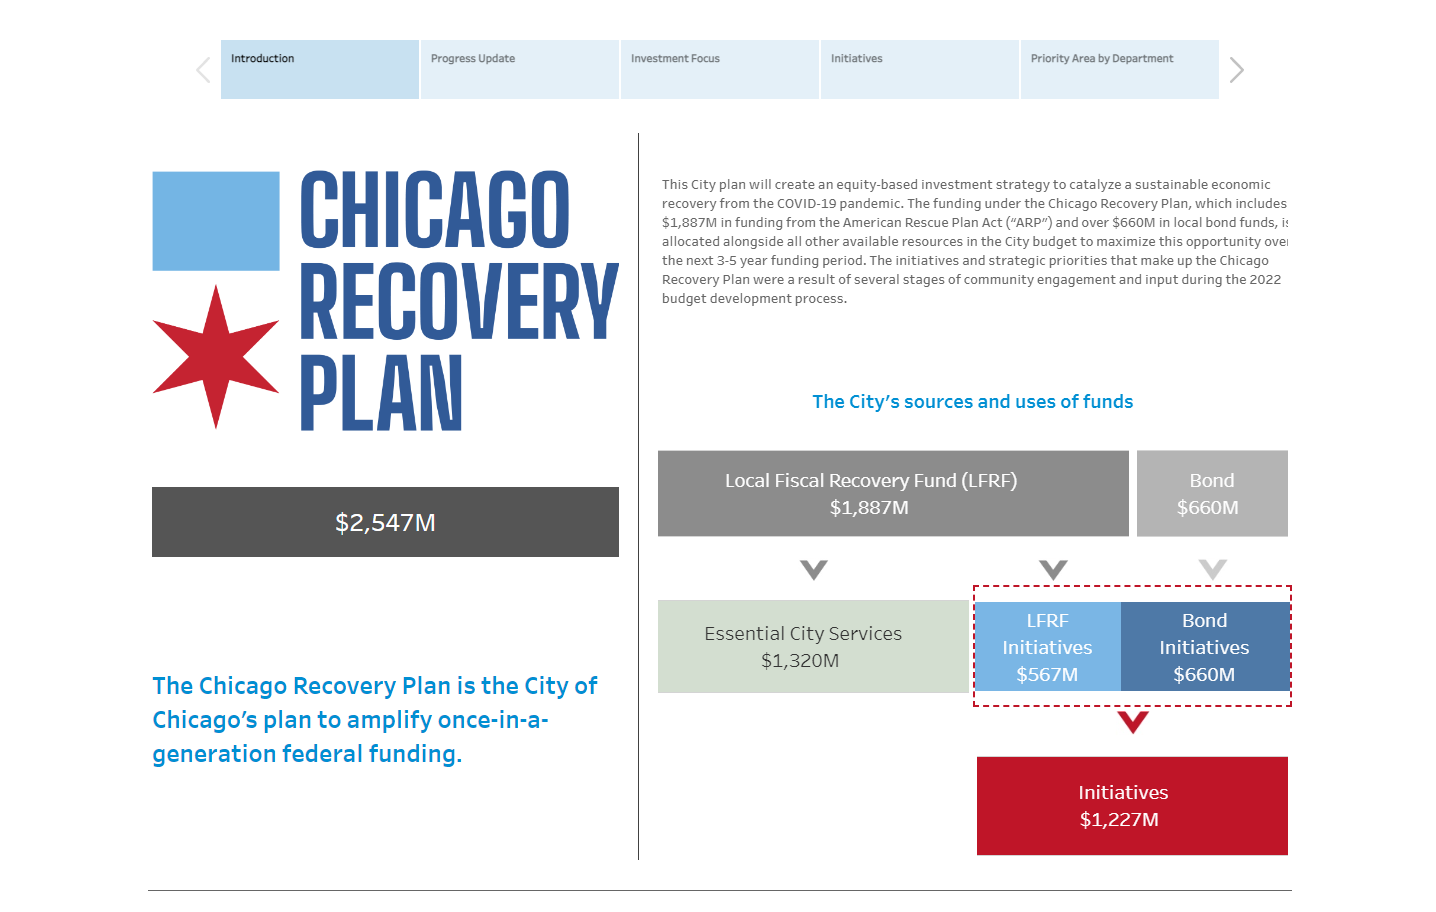
The City of Chicago announced in fall 2021 the launch of the Chicago Recovery Plan as an investment strategy to promote sustainable, equitable economic pandemic recovery. The total $2.547 billion project is funded through a combination of $1.887 billion in ARPA Local Fiscal Recovery Funds (LFRFs) and an additional $660 million in bonds.
In its FY2022 City of Chicago Budget Analysis, the Civic Federation outlined several recommendations to promote transparency in future required ARPA reporting, including[1]:
- The amount of ARPA funding and the amount of bonded debt for each initiative;
- The departments involved and the number of personnel positions with each department associated with each initiative;
- The amount of expenditures actually spent on each initiative per year; and
- For initiatives that will be continued, details about how ongoing program operations will be absorbed into the City budget.
The City has followed through with many of these recommendations in their online reporting. All of its required reports are posted online. It additionally provides funding updates through its Chicago Recovery Plan Dashboard. Within the Dashboard are several tabs providing information on the following:
- Overall sources and uses of funds;
- Progress updates that include timelines, project/funding highlights, and upcoming Dashboard updates;
- Investment Focus breaking down funding between the goals of Thriving and Safe Communities and Equitable Economic Recovery;
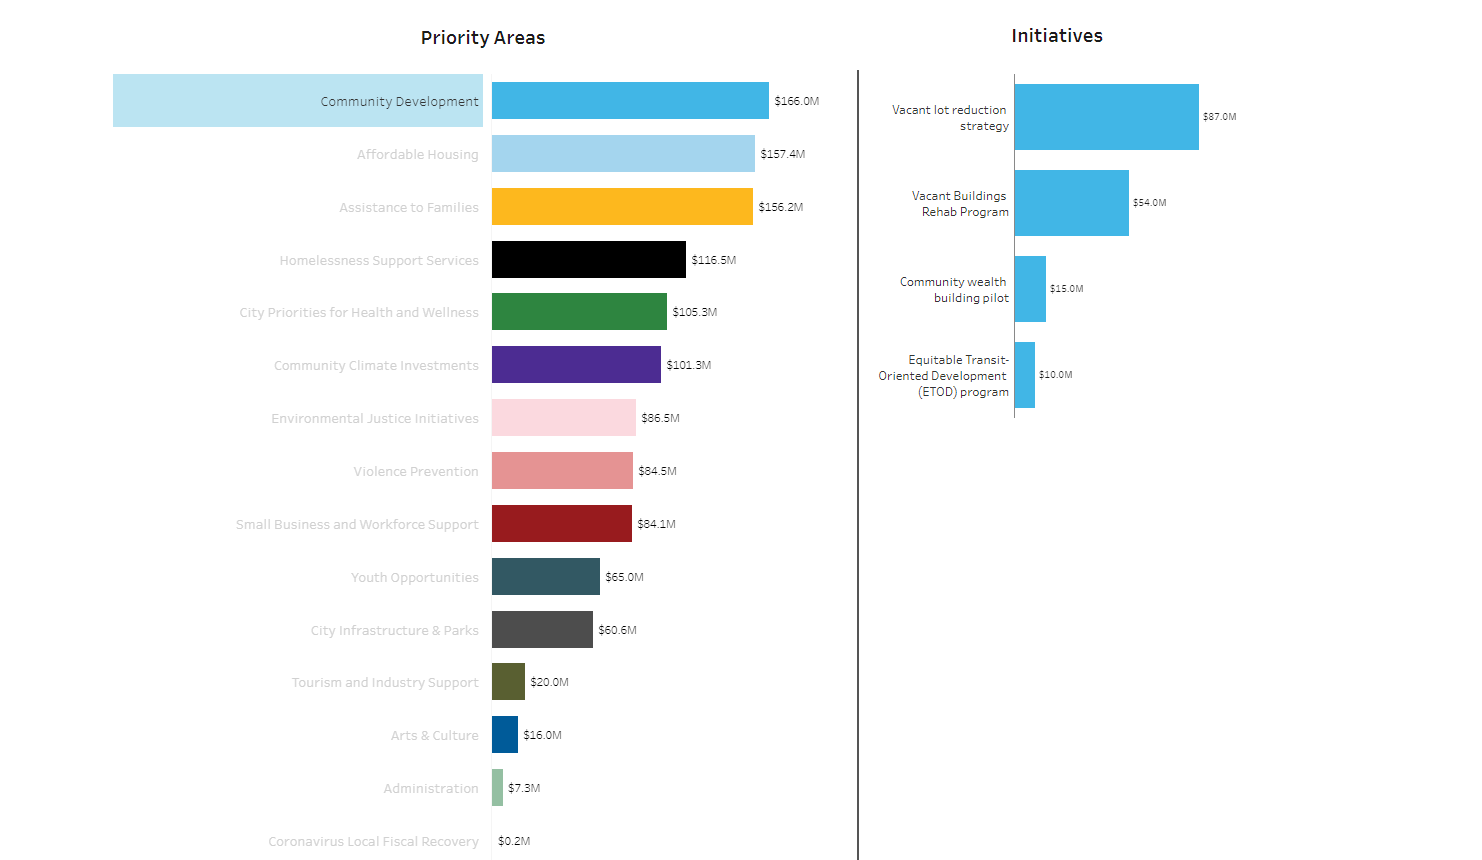
- Initiatives listing more specific numbers by priority area and breaking down funding between federal and bond funding; and
- Priority areas by department listing each initiative’s funding by department within each priority area.
Below are images of the CRP Dashboard’s Introduction and Initiatives pages.
Although not all of the Federation’s recommendations have been posted to date, the Civic Federation is pleased with the City’s efforts thus far and encourages further development of the online dashboard as initiatives and projects get underway.
Other U.S. Cities
Although every large municipality receiving ARPA support is required to submit the aforementioned reports for public review, some cities are taking better advantage of online dashboards to communicate their actions and decisions with the general public. Most cities have the same baseline information available to the public, but some offer unique components that increase public transparency of ARPA funding and provide easier ways for their residents to engage with their work.
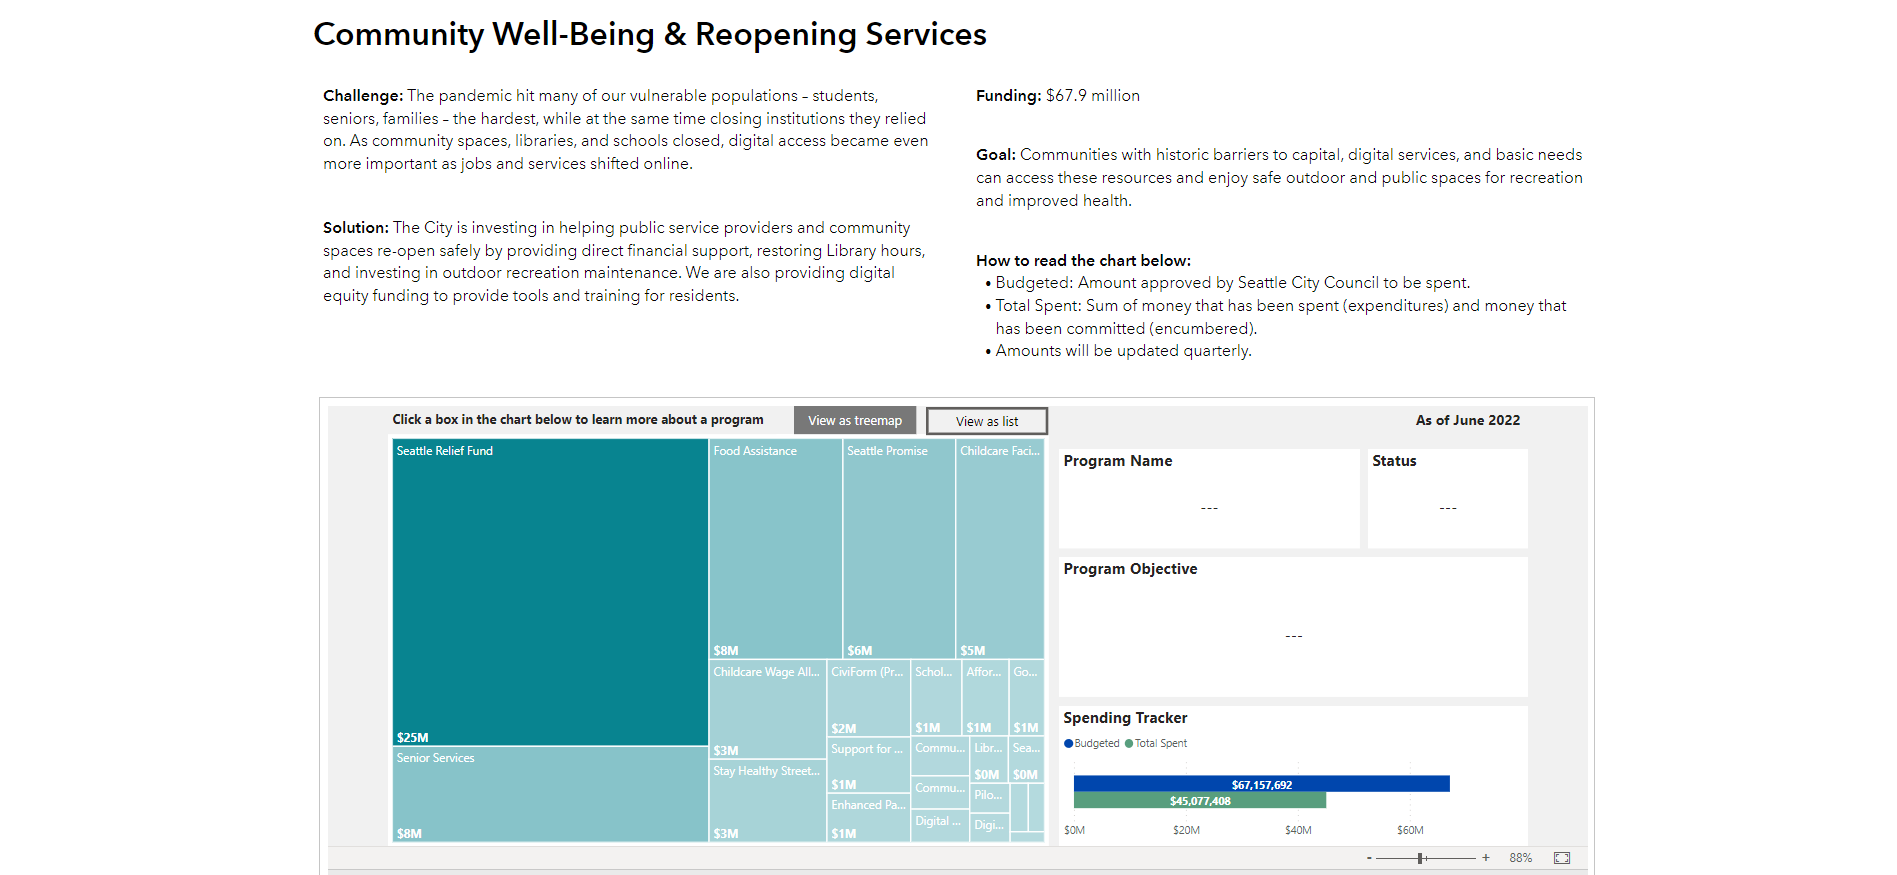
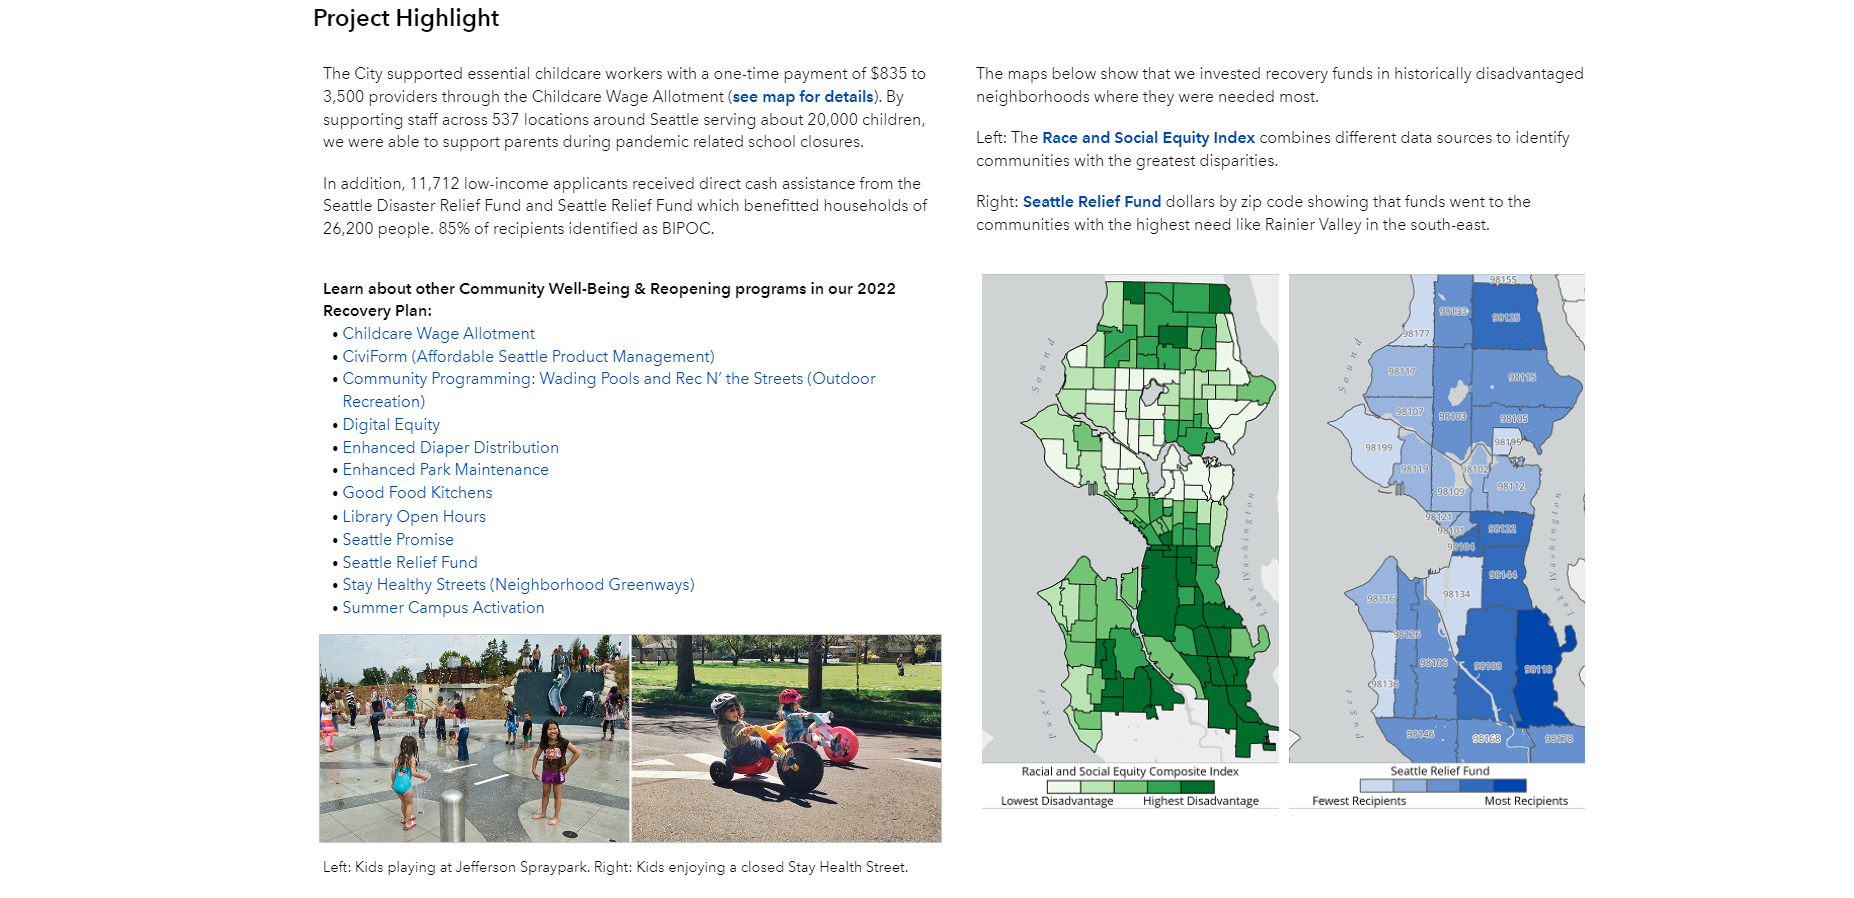
Seattle was one of the best models the Civic Federation reviewed, as their dashboard collects helpful data and provides a good level of transparency. Their Seattle Rescue Plan Transparency Portal offers a platform that is easy to navigate and conveys important information in an understandable way. In addition to the information provided by the Chicago Recovery Plan Dashboard, they also offer a breakdown of each priority area in terms of challenges and solutions, instructions for reading and use of its interactive charts, a map for which neighborhoods will be funded through ARPA investment, and the amount of money spent on each initiative so far. The images below include a screenshot of one of the interactive charts on spending by initiative within one of their priority areas, as well as a screenshot of one of their project highlights.
While Seattle has the most comprehensive of the dashboards the Federation reviewed, other cities offer unique components on their sites that increase transparency and public accountability in meaningful ways. For example, Denver offers a neighborhood recovery index of communities based on economic, health and educational index scores. Minneapolis shows several smaller dashboards that provide information on studies that were the basis for their funding allocation.
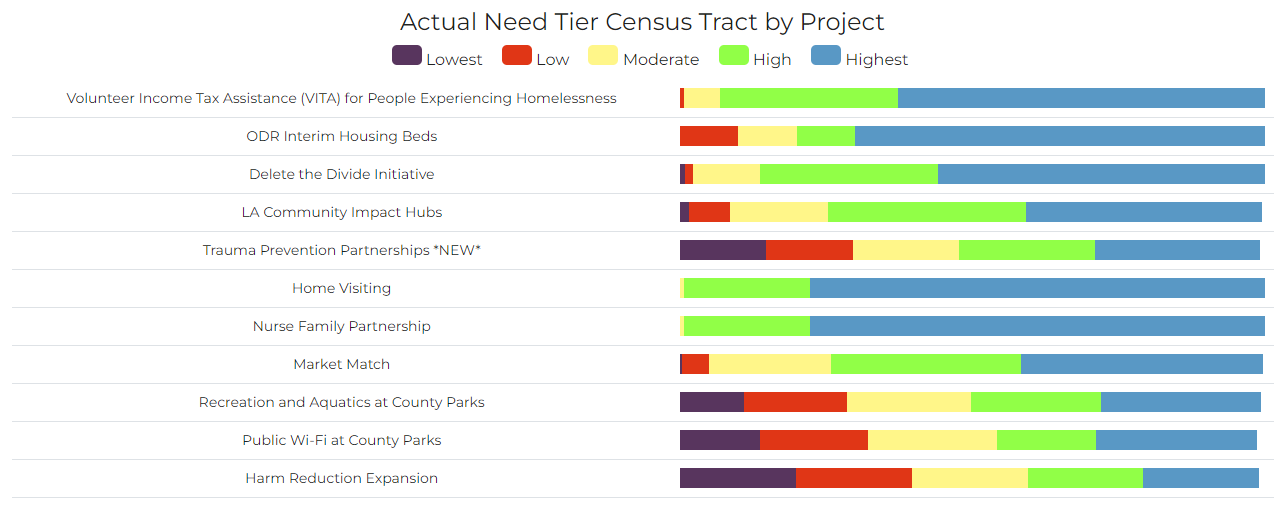
Other metropolitan areas offer other features to make their dashboards more user-friendly. Los Angeles County’s dashboard, for example, has a search function by project name, as well as several useful graphs, including a COVID Recover Index Need Tier by levels of priority, project, and target population (illustrated in the image below).
Others seek to promote accessibility of data and projects. New York City offers downloadable data of their ARPA spending by agency and initiative, and Philadelphia allows users to sign up for a newsletter with regular COVID-19 recovery updates.
Again, it should be noted that dashboards are only one of the ways in which cities and metropolitan areas can communicate the progress of their ARPA investments. More detailed information, for example, is provided in the annual performance reports. However, as many of the ARPA-funded projects come to fruition, it is important that cities continue to develop their dashboards to effectively communicate their actions to the public.
The Civic Federation will continue to monitor the progress and updates of the Chicago Recovery Plan through the City’s dashboard and reporting and will communicate important updates as they become available.
[1] Civic Federation, FY2022 City of Chicago Budget Analysis, p. 16.