
February 17, 2023
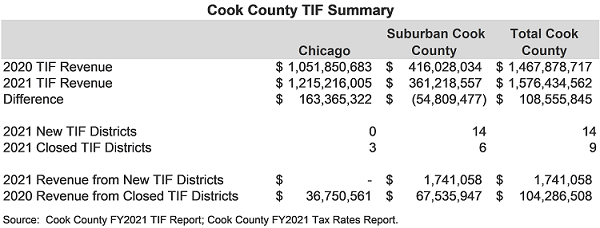
A report released by the Cook County Clerk last month found that revenue from TIF districts increased to a record $1.6 billion for FY2021, including approximately $1.2 billion from the City of Chicago and approximately $361 million from suburban Cook County. The $1.6 billion total accounts for a 7.4% increase from FY2020 and represents 9.4% of billed property taxes in the County. In total, nine TIF districts were closed in 2021 (most of which were in the suburbs) that had generated a collective $104.3 million in revenue in 2020. Additionally, 14 new TIF districts were created in 2021 and generated $1.7 million that year. The table below provides a summary of property tax and TIF information for the City and suburban Cook County.
The Clerk’s Office’s annual TIF report provides information about revenues collected for each of the County’s 448 active TIF districts in the most recent collection year compared to the prior year. Data shows that 79.1% of Chicago’s TIF districts experienced revenue growth in 2021.
The County also provides interactive maps that allow users to search for TIF data by district, address, and property identification numbers, and provides a means to download and export that data. Users can also create their own maps through drawing and text tools.
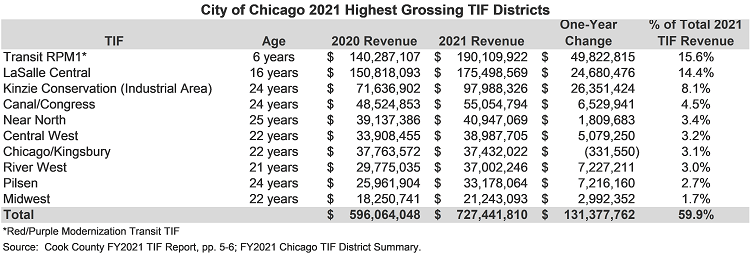
Revenues generated by the City of Chicago’s 129 active TIF districts increased from $1.05 billion in 2020 to $1.22 billion in 2021, a 15.5% increase. The primary reason for this increase is the City’s most recent reassessment, which increased taxable values by 8.3% over 2020. Since TIF revenues come from incremental growth in taxable value in a district over a frozen base amount of property value, increases to property values within TIF districts generally translate to increases in TIF revenue. The table below shows the City’s 10 highest grossing TIF districts for 2021, which account for nearly 60% of overall City TIF revenue. Nine of these districts experienced revenue growth over 2020, while one district declined by less than one percent. The largest of these districts, the Red-Purple Line Modernization Transit TIF, increased by almost $50 million. In total, these 10 districts brought in an additional $131.4 million over the prior year.
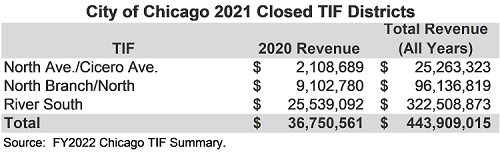
The overall revenue increase occurred in spite of three TIF districts in the City that were closed. As the table below shows, these three districts collectively generated nearly $36.8 million in 2020 and $443.9 million over their lifetimes. No new districts were created within the City of Chicago in 2021.
In property tax TIF districts, the EAV of the district at the time of creation is measured and established as a baseline, which is often called the “frozen” EAV. Tax revenues from the incremental growth in EAV over the frozen amount are used to pay for redevelopment costs. Once the redevelopment project is completed and has been paid for, the TIF district is dissolved. After dissolution, the increment EAV is added to the tax base accessible to all eligible taxing districts. Crucially, the dissolved TIF increment value is treated as new property under the Property Tax Extension Limitation Law (PTELL) for the year it is added back into the tax base, which means overlapping governments can generate additional revenue by taxing the new property. Additionally, any unspent funds in a dissolved TIF district’s accounts are distributed to the overlapping governments, based on their percentage of the tax bill.
Suburban Cook County Updates
Although TIF revenue from Chicago comprises 77% of total TIF revenue in Cook County, there are an additional 313 active TIFs in various suburban municipalities. In contrast to the City, TIF revenues in suburban Cook County saw a 13.2% decline over 2020. These declines largely derive from the North and Northwest suburbs, which experienced a 23.7% decline from 2020. Revenue in the South and Southwest suburbs did not change significantly from the prior year. According to the Clerk’s office, changes to TIF revenue in suburban Cook County in 2021 were “primarily due to decreased taxable values in the suburbs, which were not reassessed but experienced a 6.85% reduction in the Cook County Equalization Factor issued by the Illinois Department of Revenue.”
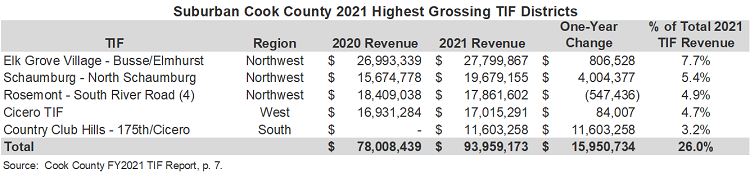
The table below shows the five highest grossing TIF districts in suburban Cook County. All but one showed revenue increases over FY2020. Collectively, these five districts account for 26% of all suburban TIF revenue and accounted for nearly $16 million in revenue growth over 2020.
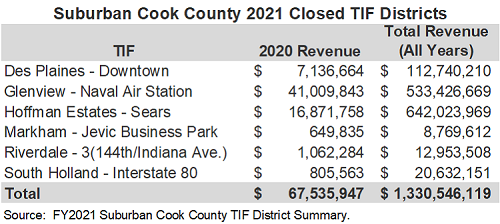
Six suburban TIFs were closed in 2021, as illustrated in the table below. Three of these districts were among the highest grossing in the suburbs. Cumulatively, these six districts generated $67.5 million in revenue for FY2020.
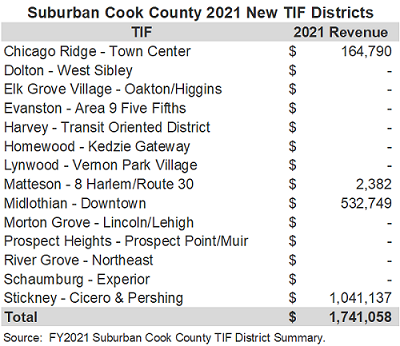
Additionally, 14 new TIF districts were established in suburban Cook County, only four of which began generating revenue in FY2021, as shown below. Those four districts generated approximately $1.7 million in revenue their first year.
Related Links:
Cook County TIF Quick Facts 2021
2021 Cook County Tax Rates Report