
March 25, 2022
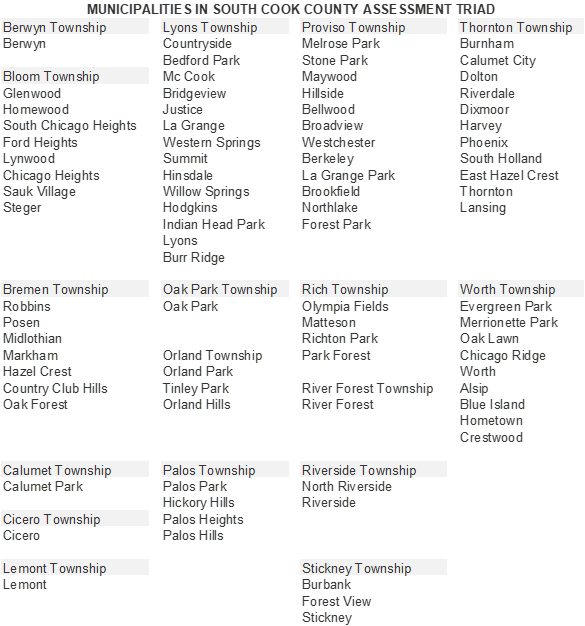
This post presents information on residential and commercial effective property tax rates in south Cook County municipalities in tax years 2005, 2008, 2011, 2014, 2017 and 2019. These 84 municipalities are all located in the South Cook County Assessment Triad.[1] The report also compares these effective tax rates to those for the City of Chicago in these selected years.
Effective property tax rates are a measure of property tax burden for homeowners and businesses. They translate the tax rates on property tax bills into “effective” rates that reflect the percentage of full market value that a property owed in taxes for a given year. More specifically, multiplying the market value of a home or business property by the applicable effective tax rate provides an estimate of the property taxes due on that property in a given tax year. For example, a property with a market value of $300,000 and an effective tax rate of 2% would have an estimated property tax liability of $6,000.
By standardizing the expression of property tax burdens, effective property tax rates provide a method of comparing average property tax burdens in different areas over time. However, these are estimates for the purpose of broad comparison rather than precise expressions of tax burden on specific properties.
Effective property tax rates should be regarded only as estimates for several reasons:
- There are multiple property tax rates within each municipality, and the effective rate calculated in this report is a representative sample showing only one of those tax rates.
- Effective property tax rates for residential properties do not include homestead, senior or other exemptions. (See explanation of exemptions below).
- The effective tax rate calculations utilize information on the median level of assessment within a given geographical area. While a property is likely to be near the median level of assessment, the actual level of assessment for any given property could be greater or lesser than the median.
It is also important to recognize that a decreasing effective tax rate does not necessarily translate into decreased tax liabilities. A property owner whose property is appreciating in value may experience annual property tax increases despite a decreasing effective tax rate.
Reasons for Changes in Effective Tax Rates
Changes in effective tax rates over time are due to changing actual composite tax rates, changing median levels of assessment, or both.
For example, Orland Park’s actual composite property tax rate for tax code 28011 (School District #135) increased from 7.629% in 2005 to 9.413% in 2019. Over the same time period, the median level of assessment as calculated by the Illinois Department of Revenue decreased from 9.64% to 9.02% for residential properties or 6.43% and fell by a greater amount for commercial properties, declining from 23.41% to 20.34% or 13.11%.[2]
The larger decrease in the commercial property median level of assessment produced an increase in the estimated effective tax rate for commercial properties from 4.88% to 5.58%, which is a 14.4% increase. At the same time, the smaller decrease in the residential property median level of assessment produced an increase in the estimated effective tax rate from 2.01% to 2.48% or a 23.2% increase, as the tax burden shifted from commercial to residential properties. In Cook County, changes in the equalization factor can also impact effective tax rates.[3]
Major Findings
The major findings of this report are summarized here for both residential and commercial effective tax rate calculations for the 84 municipalities in the South Triad as well as the City of Chicago.
There have not been enough sales of industrial property in Cook County’s South Triad reassessment district for the Illinois Department of Revenue to compute industrial median levels of assessment in tax years 2008, 2014, 2017 and 2019. As a result, the data are incomplete for this sector, and the Civic Federation has not computed effective industrial property tax rates for any of the years in this study.
Residential Effective Tax Rates
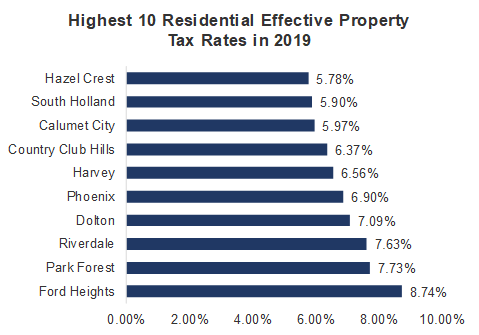
- The Village of Ford Heights reported the highest effective residential tax rates in both 2019 and 2005, at 8.74% and 4.32%, respectively.
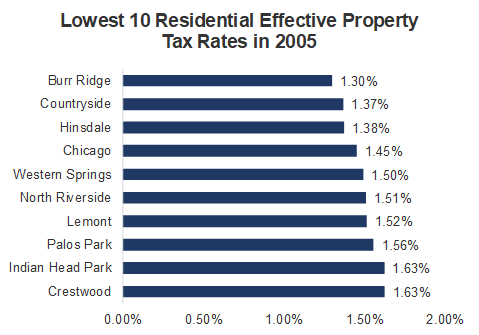
- The Village of Burr Ridge had the lowest effective tax rates in 2019 and 2005, at 1.74% and 1.30%, respectively.
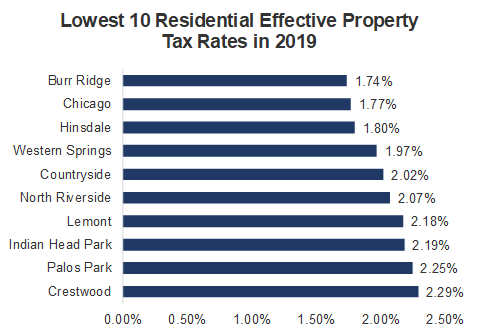
- The City of Chicago had lower effective tax rates in 2019 than all South Cook County municipalities except Burr Ridge in 2019, when its rate was 1.77%, and all but Hinsdale, Countryside and Burr Ridge in 2005, when its rate was 1.45%.
- In 2019, a majority of the 85 municipalities–52 in total–had effective residential tax rates between 2.00% and 4.00%.
- 22 municipalities had effective property tax rates between 4.00% and 6.00%.
- Only four municipalities had tax rates lower than 2.00%: Western Springs (1.97%), Hinsdale (1.80%), Chicago (1.77%) and Burr Ridge (1.74%).
- The median effective property tax rate was 3.45%.
- Between 2005 and 2019, a plurality of municipalities, or 34 of the 85 reviewed, reported increases between 50.0% and 70.0%.
- Nine municipalities had percentage change increase in excess of 100.0%: South Chicago Heights (130.11%), Riverdale (122.33%), Hazel Crest 114.62%), Phoenix (114.31%), Country Club Hills (111.88%), Dolton (108.93%), Thornton (107.98%) Park Forest (107.06%) and Ford Heights (102.09%).
- Only four municipalities had increases between 20.0% and 30.0%: Flossmoor (21.71%), Chicago (21.85%), Orland Park (23.22%) and Orland Hills (29.93%).
- Cicero was the only municipality reporting a percentage increase below 20.0%, at 18.43%.
- The median percentage increase in residential effective tax rates was 59.60%.
Commercial Effective Tax Rates
- The Village of Ford Heights reported the highest effective commercial tax rates in both 2019 and 2005, at 19.19% and 11.43%, respectively.
- The City of Chicago had the lowest commercial effective tax rate in 2005, at 2.37%. In 2019, the village of Burr Ridge had the lowest rate at 4.14%.
- In 2019, 38 of the municipalities reported rates between 4.00% and 8.00%.
- A second group of 36 municipalities, 42.35% of the total, reported rates between 8.00% and 12.00%.
- Six jurisdictions—Ford Heights (19.19%), Riverdale (19.18%), Park Forest (18.26%), Dolton (17.83%), Phoenix (17.34%) and Harvey (16.49%)—had rates in excess of 16.0%.
- The Village of Burr Ridge had the lowest rate at 4.14%.
- The median commercial effective property tax rate was 8.26%.
- Between 2005 and 2019, a majority of the municipalities—46 in all—experienced commercial effective tax rate percentage increases of 30.0% to 60.0%.
- The percentage change exceeded 90.0% in nine jurisdictions: Riverdale (116.81%), Phoenix (108.99%), Dolton (103.74%), Park Forest (103.73%), Thornton (102.82%), Hazel Crest (102.03%), Country Club Hills (99.45%), South Holland (91.79%) and South Chicago Heights (91.08%).
- The Village of Orland Park reported the lowest percentage increase, at 14.42%.
- In this period Chicago had a 78.29% tax rate increase.
- The median percentage increase in commercial effective tax rates was 50.88%.
Methodology
The effective tax rates calculated in this report are based on data from the Illinois Department of Revenue and the Clerk of Cook County. County Clerks calculate the composite property tax rates for each tax code within the county. The Illinois Department of Revenue calculates the equalization factor for each county as well as the median levels of assessment.
The equalization factor is a multiplier that is applied to all assessed values in a county to ensure that the total equalized assessed value of the county equals 33⅓% of fair market value.[4] The application of the multiplier is known as inter-county equalization. All counties, including Cook, are required to undergo equalization to ensure that the total value of real property is 33⅓% of market value.[5]
The Department of Revenue collects data on property sales and calculates the ratio of assessed values to sales values. A median assessment/sales ratio is computed, as well as an adjusted median ratio if additional data is submitted by the County Assessor after the initial data was collected. This median ratio is commonly referred to as the “median level of assessment.”
For every county except Cook, the median level of assessment is for all types of property. For Cook County, which classifies property by type for real estate tax purposes, separate medians are computed for different classes of property. The Cook County real estate classification ordinance requires that residential (Class 2) properties be assessed at 10% and commercial (Class 5a) and industrial (Class 5b) properties at 25% of market value beginning in tax year 2009.[6] One result of this change was to bring the ordinance levels of assessment closer to the median levels of assessment computed in the Illinois Department of Revenue’s assessment/sales ratio studies. In the past, median levels of assessment diverged significantly from the ordinance levels due to underassessment, including reductions by the Assessor and the Board of Review.
Special note should be taken that the Department of Revenue’s ratio studies indicate a high coefficient of dispersion for commercial and industrial assessments, which means there is likely to be wide variation within each of these classes from the calculated median for individual properties whose reported sale prices were included in the study.
To calculate effective tax rates, the median level of assessment is multiplied by the equalization factor to approximate the percentage of a property’s total value that is taxed. This percentage is then multiplied by the actual composite tax rate to produce the effective tax rate. The adjusted median level of assessment is used when it is available in the Department of Revenue data. The median level of assessment for the most specific geographic area is also used when it is available. Therefore, township median levels of assessment are used unless they are unavailable, in which case the median level of assessment for the whole reassessment triad is used.
There have not been enough sales of industrial property in Cook County’s South Triad reassessment district for the Illinois Department of Revenue to compute industrial median levels of assessment in tax years 2008, 2014, 2017 and 2019. As a result, the data are incomplete for this sector and the Civic Federation has not computed effective industrial property tax rates for any of the years in this study.
This study provides effective tax rates for selected tax codes[7] in 85 municipalities in the South Cook County assessment triad for tax years 2005, 2008, 2011, 2014, 2017 and 2019. These municipalities are listed in the table below. Except for 2019, each of these tax years is a year in which the properties in the south Cook triad are reassessed. Tax year 2019 is included in this study because it is the last year for which complete information is available to calculate effective tax rates.
Effects of Exemptions on Residential Effective Tax Rates
Property tax exemptions available to eligible homeowners reduce the taxable value of their property. Exemptions lower the estimated effective tax rate of a homestead property by varying amounts depending on the market value and exemption value. For example, the 2019 effective tax rate for an Orland Park residential property not eligible for exemptions is 2.48% of full market value. The examples below show how that rate will differ for individual exemption-eligible homesteads depending on their 2019 market value and exemption value.[1] However, the Civic Federation cannot incorporate homestead exemptions into its calculations of effective tax rates because our calculation of effective rates does not evaluate individual properties, but instead uses aggregate estimates.
Other studies of effective tax rates, such as those produced periodically by the Taxpayers’ Federation of Illinois, use hypothetical home values to calculate effective tax rates for different municipalities and are therefore able to incorporate homestead exemptions into their analysis.[2]
The following are several examples of effective tax rates after accounting for exemptions.
- $300,000 Orland Park home receiving the maximum $10,000 Homeowner Exemption: Effective Tax Rate 2.16%.
- $300,000 Orland Park home receiving a Senior Citizen Exemption ($8,000) and the maximum $10,000 Homeowner Exemption: Effective Tax Rate 1.91%.
- $400,000 Orland Park home receiving a Senior Citizen Exemption ($8,000) and the maximum $10,000 Homeowner Exemption: Effective Tax Rate 2.12%.
- $200,000 Orland Park home receiving a Senior Citizen Exemption ($8,000) and the maximum $10,000 Homeowner Exemption: Effective Tax Rate 1.77%.
Residential Effective Tax Rates: 2005 to 2019
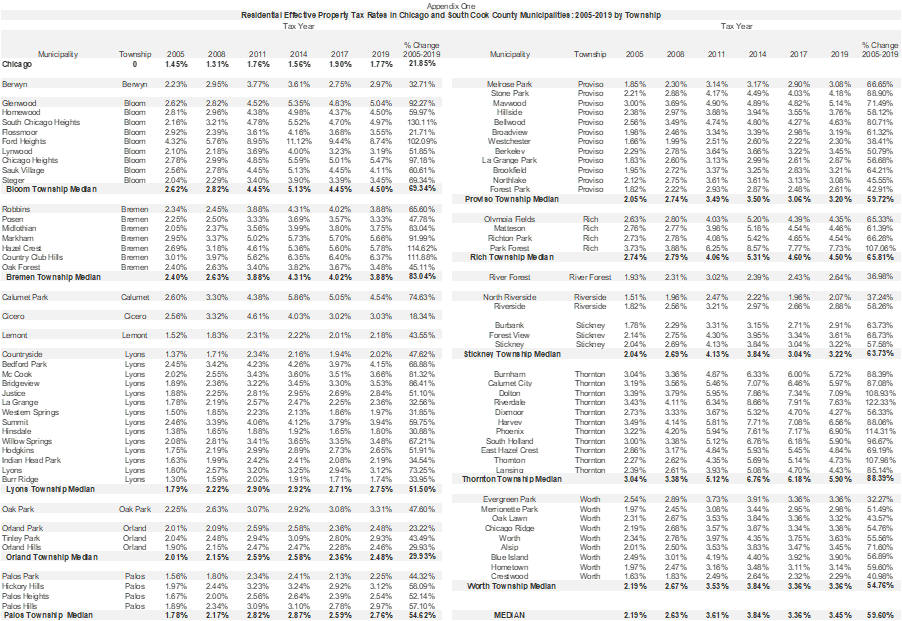
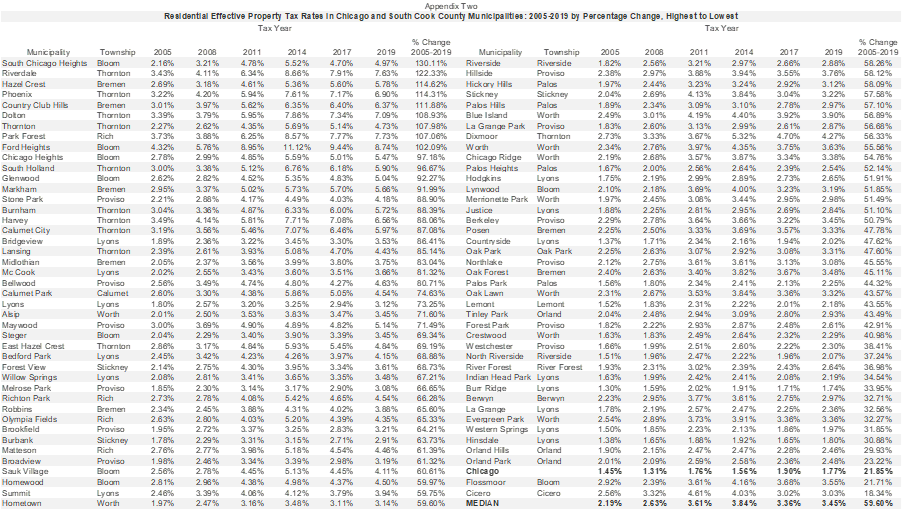
The following charts illustrate residential effective tax rates in the South Cook County assessment triad for municipalities and Chicago between tax year 2005 and 2019. Complete information for all municipalities for all tax years evaluated can be found in Appendices One and Two.
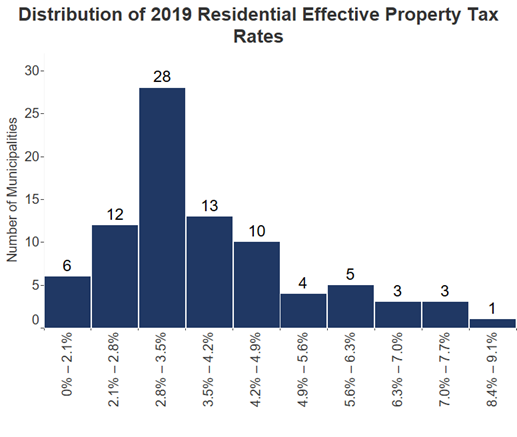
The first chart is a histogram showing the distribution of 2019 residential effective tax rates. Each bar shows how many municipalities fell within a certain range of effective tax rates. A histogram is used here because it is helpful to understand visually how common different levels of effective tax rates are across the Cook County southland. The most common range of effective tax rates, for example, is easily seen in the graph below to be the 2.8% to 3.5% range with 28 municipalities clustered there. It is also easy to identify outliers. Only one municipality, Ford Heights, had a rate above 8.00%, at 8.74% and six had a rate below 2.1%, including the four lowest under 2.0%: Western Springs (1.97%), Hinsdale (1.80%), Chicago (1.77%) and Burr Ridge (1.74%). Fifty-three of the municipalities, or 62.3% of the 85 municipalities, had rates between 2.1% and 4.2%. Another 10 municipalities, 22.3% of the total, had rates between 4.2% and 6.3%. The median effective property tax rate was 3.45%.
The histograms in this report are shown without spaces between the bars to differentiate them from the bar charts.
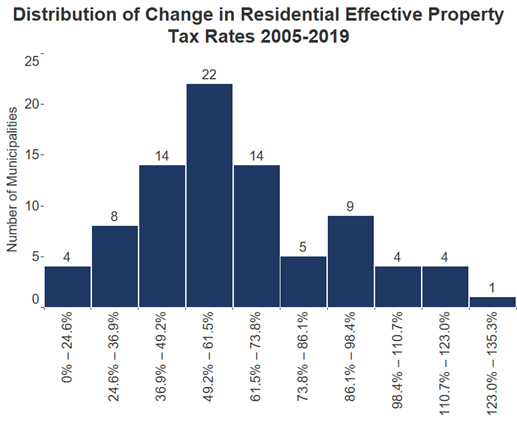
The second histogram shows the distribution of the percentage increase in residential effective tax rates between tax year 2005 and tax year 2019. The percentage change exceeded 100.0% in nine jurisdictions: South Chicago Heights (130.1%), Riverdale (122.3%), Hazel Crest 114.6%), Phoenix (114.3%), Country Club Hills (111.9%), Dolton (108.9%), Thornton (108.0%), Park Forest (107.1%) and Ford Heights (102.1%).
The largest grouping of municipalities, or 22 of the total, reported increases between 49.2% and 61.5% over the 2005-2019 period.
Only four municipalities had increases of less than 25.0%: Orland Park (23.2%), Chicago (21.9%), Flossmoor (21.7%), and Cicero (18.3%). The median percentage increase was 59.6%.
Highest and Lowest Residential Effective Tax Rates in 2005 and 2019
The ten municipalities with the highest residential effective tax rates in 2005 and 2019 are shown in the bar charts below. Ford Heights reported the highest effective tax rates in both 2005 and 2019, at 4.32% and 8.74%, respectively. The list of the highest 10 included nine communities in both years: Ford Heights, Park Forest, Harvey, Riverdale, Dolton, Phoenix, Calumet City, Country Club Hills and South Holland.
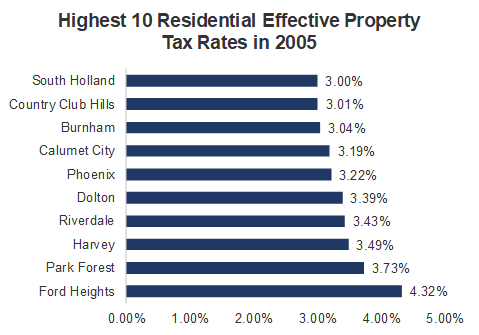
The Village of Burr Ridge had the lowest residential effective tax rates of the 85 municipalities analyzed in both 2005 (1.30%) and 2019 (1.74%). The same ten municipalities had the lowest effective residential tax rates in both 2005 and 2019.
Commercial Effective Tax Rates: 2005 to 2019
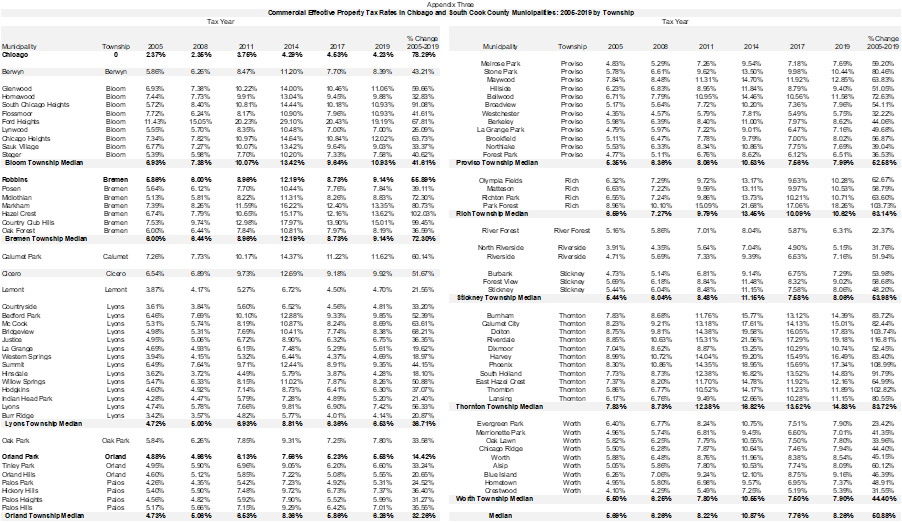
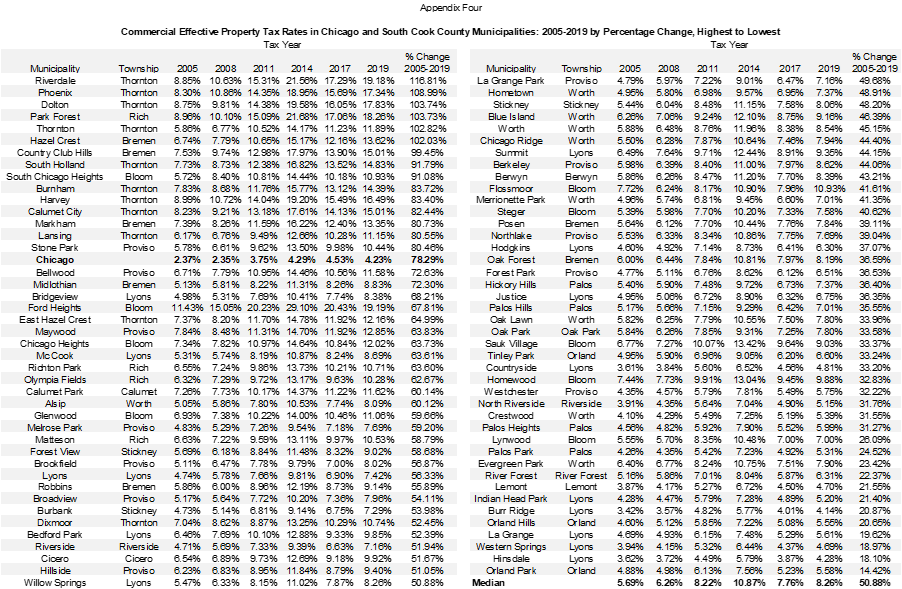
The next four charts show commercial effective tax rates in South Cook County assessment triad municipalities and the City of Chicago between tax year 2005 and 2019. Complete information for all municipalities for all tax years evaluated can be found in Appendices Three and Four.
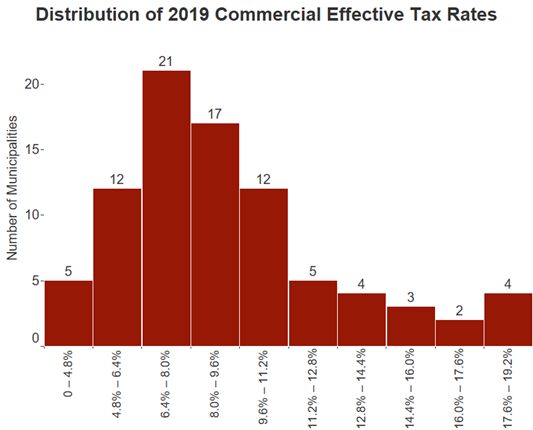
The first chart is a histogram showing the distribution of 2019 commercial effective tax rates. Each bar shows how many municipalities fell within a certain range of effective tax rates. A histogram is used here because it is helpful to understand visually how common different levels of effective tax rates are across the Cook County southland. The most common range of effective tax rates, for example, is easily seen in the graph below to be the 6.4% to 8.0% range with 21 municipalities clustered there. It is also easy to identify outliers. Four municipalities, for example, had effective tax rates above 17.6%: Dolton (17.8%), Park Forest (18.3%), Riverdale (19.2%) and the Village of Ford Heights (19.2%). The village of Burr Ridge was one of five municipalities with the lowest rates at 4.14%.
Thirty-eight of the municipalities, or 44.7% of the 85 municipalities, reported effective commercial tax rates between 6.4% and 9.6%.
The median commercial effective property tax rate was 8.3%.
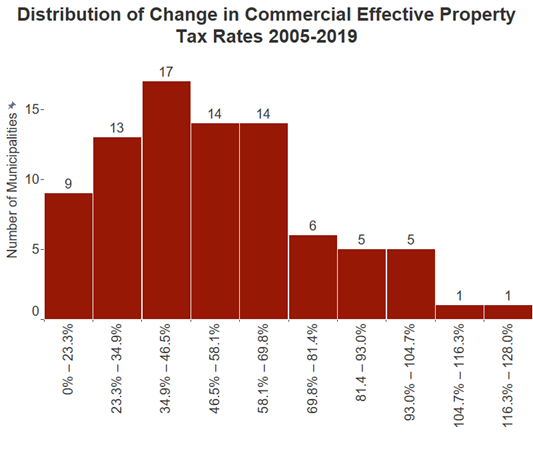
The second histogram shows the distribution of the percentage increases in commercial effective tax rates between tax year 2005 and tax year 2019
A supermajority of the municipalities - 67 in all - experienced commercial effective tax rate percentage increases below 70%. The percentage change in the highest seven jurisdictions exceeded 100% for Riverdale (116.8%), Phoenix (109.0%), Dolton (103.7%, Park Forest (103.7%), Thornton (102.8%), Hazel Crest (102.0%). The increase in Country Club Hills was 99.4%. The Village of Orland Park reported the lowest percentage increase, at 14.4%. The City of Chicago had a 78.3% tax rate increase in this period.
The median commercial effective tax rate increase 2005-2019 was 50.9%.
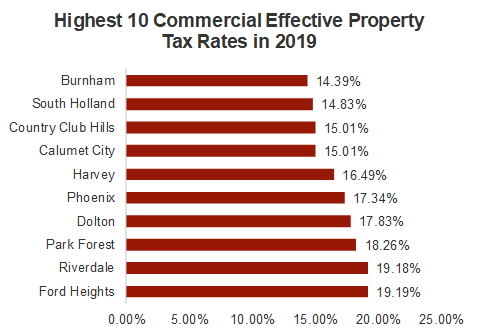
Highest and Lowest Commercial Effective Tax Rates in 2019 versus 2005
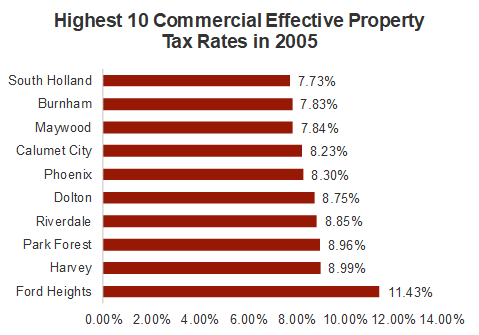
The ten municipalities with the highest commercial effective tax rates in 2005 and 2019 are shown in the bar chart below. Ford Heights reported the highest effective tax rates in both 2019 and 2005, at 19.19% and 11.43%, respectively.
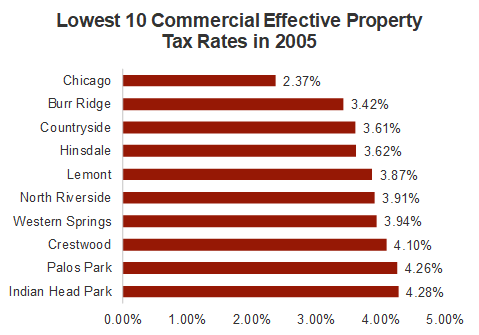
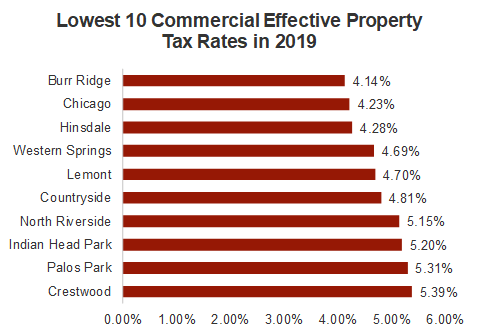
The ten municipalities with the lowest commercial effective tax rates in 2005 and 2019 are shown below. The City of Chicago had the lowest commercial effective tax rate 2005, at 2.37%. In 2019 the Village of Burr Ridge claimed the lowest rate at 4.14%.
Click on any of the following appendices to open in a new window.
[1] Public Act 100-0401, signed into law on August 25, 2017 increased the homeowner exemption in Cook County to $10,000 from $7,000 and the senior citizen exemption to $8,000 from $5,000 beginning in tax year 2017 for taxes payable in 2018. In all other counties the senior citizen exemption is $5,000 and the homeowner exemption is $6,000.
[2] See Taxpayers’ Federation of Illinois March 2018 Tax Facts, “Effective Property Tax Rates for 89 Illinois Municipalities,” Available at: https://www.illinoistax.org/wp-content/uploads/2018/05/16_March2018TaxFactsnew.pdf
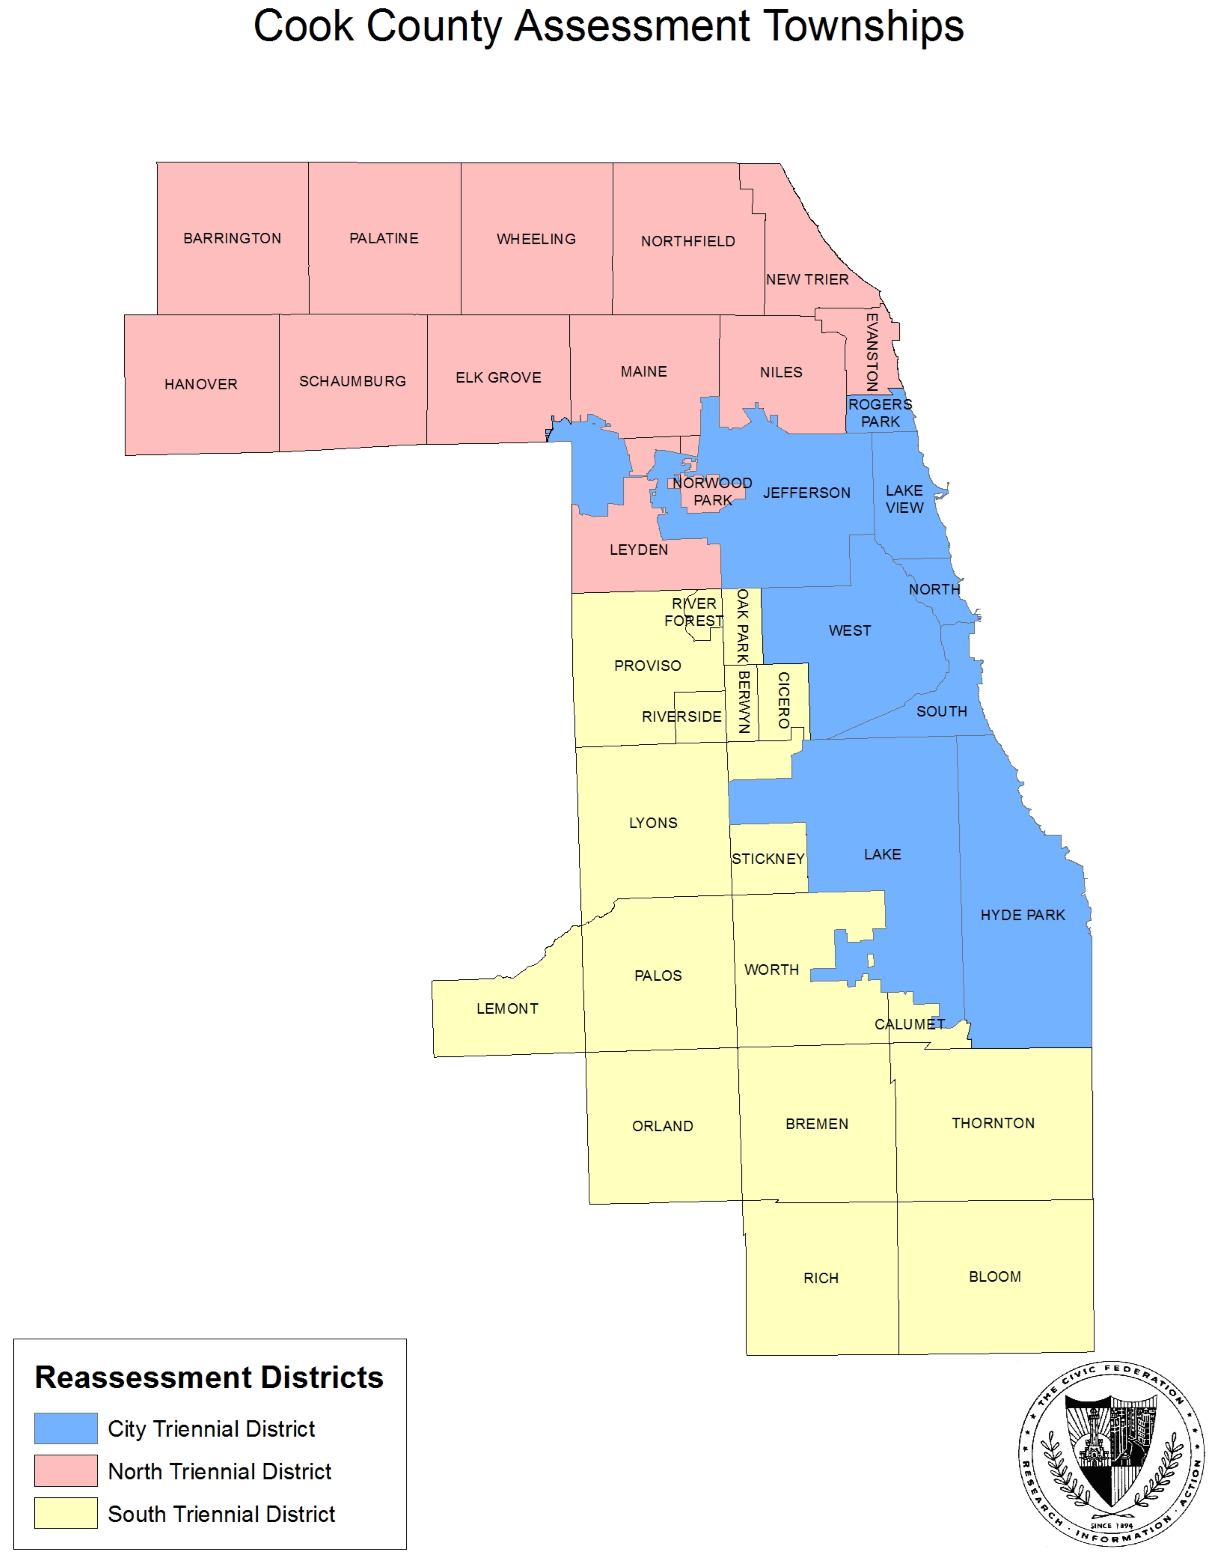
[3] Cook County is divided into three districts (or “triads”) for the purpose of property assessment: City of Chicago, north/northwest suburbs and south/southwest suburbs. See the Appendix for a map of the Cook County reassessment districts.
[4] See the Illinois Department of Revenue’s Assessment Level Ratios, available at https://www2.illinois.gov/rev/research/taxstats/PropertyTaxStatistics/Pages/default.aspx.
[5] The collar counties’ equalization factors do not generally change significantly from year to year because they do not set different property tax assessment levels for different types of property. Cook County is the only county in Illinois that uses differential assessment, also known as classification.
[6] Equalization is necessary for the fair implementation of certain state statutes, including those related to education, transportation and other grants. See the Civic Federation’s “The Cook County Property Assessment Process: A Primer on Assessment, Classification, Equalization, and Property Tax Exemptions” available at www.civicfed.org.
[7] 35 ILCS 200/9-210.
[8] Cook County ordinance 08-O-51. Previous levels were 16% for Class 2, 38% for Class 5a and 36% for Class 5b.
[9] Property tax codes report a composite property tax rate per parcel; this is the aggregate property tax rate for all taxing bodies levying property taxes on that parcel. Municipalities commonly include a number of tax codes.