
July 10, 2014
Second installment property tax bills for Cook County residents were mailed out this month, the third year in a row that they have been sent out on time. Between tax year 1977 and tax year 2011, second installment bills were sent out late every year according to the elected officials associated with the Cook County property tax process.
Cook County Clerk David Orr’s office released the 2013 Cook County Tax Rates Report on June 19, 2014. The report lists property tax rates for all taxing districts in Cook County and provides sample composite rates for many municipalities. The composite rate is the total tax rate that appears on a tax bill; it includes tax rates for the municipality and all overlapping jurisdictions such as school districts.
Property tax rates are calculated using two primary pieces of information: the taxing district’s levy, which is the amount of property tax revenue the district requests from taxpayers, and the Equalized Assessed Value (EAV), or taxable value of property.
Conceptually, a property tax rate = levy ÷ EAV
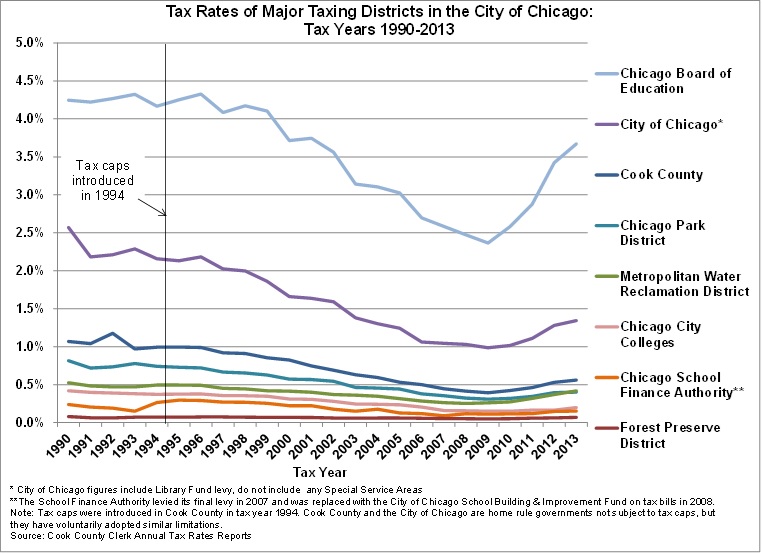
The composite tax rate on a typical City of Chicago tax bill will increase by 6.82% from a rate of 6.396% last year to 6.832%. This is the fourth year in a row the rate has increased. Since the late 1990s, composite tax rates steadily declined until they grew from 4.627% to 4.931% in tax year 2010. The rise in tax rate does not mean that individual tax bills will necessarily increase, as is explained at the end of this blog post.
Tax rates fell dramatically in Chicago over the past decade due to significant increases in EAV. However, that trend has stopped because EAV has fallen in recent years. EAV fell by 4.42% in the City of Chicago, from $65.3 billion in tax year 2012 to $62.4 billion in tax year 2013. The City’s EAV peaked at $84.6 billion in tax year 2009, so over the last four years, EAV has dropped 26.3%.
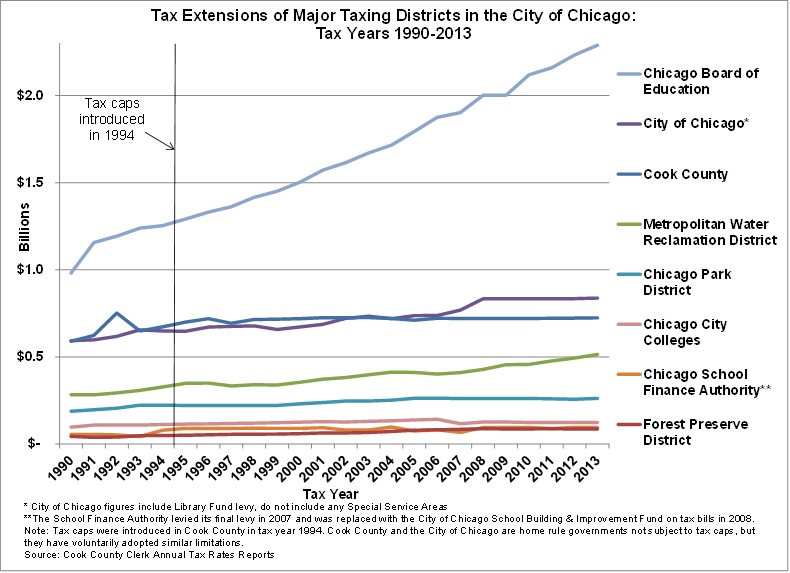
At the release of the 2013 tax rates, Tax Extension Manager Bill Vaselopulos reported that countywide tax extensions for all governments increased from $12.0 billion in tax year 2012 to $12.1 billion in tax year 2013. The tax extension is the final amount of property tax revenue that a unit of local government is authorized to receive and that is billed to taxpayers.
The following two graphs show the increase in property tax extensions for the primary governments on a City of Chicago property tax bill from 1990 to 2013 and the decrease in tax rates over the same period until the trend reversed in 2010. Tax rates had fallen despite tax extensions increasing for several governments because the overall taxable value of property had increased more than extensions. For more on how this works, read the Civic Federation’s Tax Extension primer.
The new tax rates are printed on second installment 2013 tax bills, which are due on August 1, 2014.
First installment 2014 bills are expected to be due on March 1, 2015 and will be equal to 55% of the tax year 2013 tax bill.
Will your tax bill go up or down? As noted in this blog post, predicting individual tax bills is impossible because they depend not only on the amount of revenue requested by local governments but on changes to the relative value of one property compared to other properties and whether homeowners qualify for exemptions.
None of the Cook County offices involved with property taxation produces an analysis of year-to-year changes in the tax bills of the nearly 1.9 million real estate parcels countywide, so there is no average or median data available on how many tax bills increase or decrease each year. Some property taxpayers’ bills do decline in a given year as the burden is shifted among properties while others may increase.