November 20, 2014
The Cook County Clerk’s Office annually releases a tax rate report that provides the tax rates for various taxing agencies within Cook County. It is important for property taxpayers to have an accurate picture of which governments receive their property tax dollars and for what purpose so that taxpayers may hold public officials accountable for the level of taxation imposed.
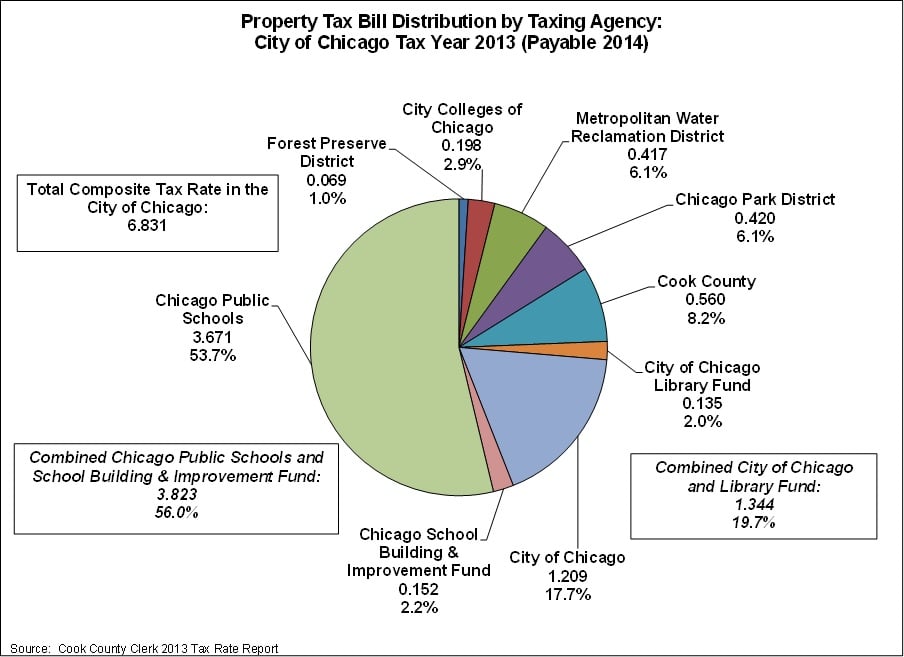
The largest portion of a Chicago property owner’s tax bill goes to the Chicago Public Schools, which accounts for 53.74% of the entire tax bill. In addition, 2.2% of the entire property tax bill goes to the Chicago School Building & Improvement Fund. The combined tax rate of Chicago Public Schools and the Chicago School Building & Improvement Fund is 3.823% and makes up approximately 56.0% of a typical City of Chicago property tax bill. The City of Chicago has the second largest tax rate of 1.209% and receives 17.7% of a typical City of Chicago tax bill to fund city operations. However, the City of Chicago portion does not represent all property taxes effectively paid to the City. The City of Chicago also levies on behalf of the Chicago Public Library, which is a department of the City. The City of Chicago Library Fund tax rate is 0.135% and makes up 2.0% of a typical Chicago tax bill. The combined tax rate for the City of Chicago and the Chicago Library Fund is 1.344% and makes up 19.7% of the typical City of Chicago tax bill.
The property tax rates of the various governments and their pension funds are printed on property tax bills so that taxpayers may see an estimate of how much of their tax bill goes to which government.[1] The Cook County Clerk also publishes a pie chart showing the distribution of the City of Chicago tax bill among the different governments.[2] The 2013 distribution of property taxes is reproduced below. However, it is important to note that the City of Chicago tax rate includes taxes levied for Chicago Public Schools to pay for the District’s capital needs as well as taxes levied for the City Colleges of Chicago to pay debt service on capital improvement bonds so it is higher than it would be if Chicago Public Schools and City Colleges levied for those purposes themselves. Thus the pie chart is simply an approximation of the distribution of property tax dollars among these local governments because it also does not include tax increment financing (TIF) revenue. The City of Chicago took in $422.0 million in TIF revenue in tax year 2013. For more information on the City of Chicago property tax see pages 39-47 of the Civic Federation’s FY2015 City of Chicago Budget Analysis and Recommendations.
The following chart shows each taxing agency’s tax rate and percentage of the total composite tax rate in the City of Chicago, as reported by the Cook County Clerk.